First thing first, this is probably the first time in any of my blog posts that I can use a letter that is part of my native alphabet, namely the “æ”. I tried to look up whether I should stick to Træfik or not, so I ended up on this post by Traefik themselves, its not the letter “Æ” itself that is the reason behind the use of it, but it is the phonetic pronunciation of Traefik = ’træfik’. Nice that the letter “æ” has some use internationally though 😄 A fun and nice post though.
For the rest of the post I will stick to using Traefik instead of Træfik as Træfik is just the logo and how Traefik is pronounced, it is called Traefik (and to be kind to the non native “æ” speakers out there).
From the offical Traefik homepage:
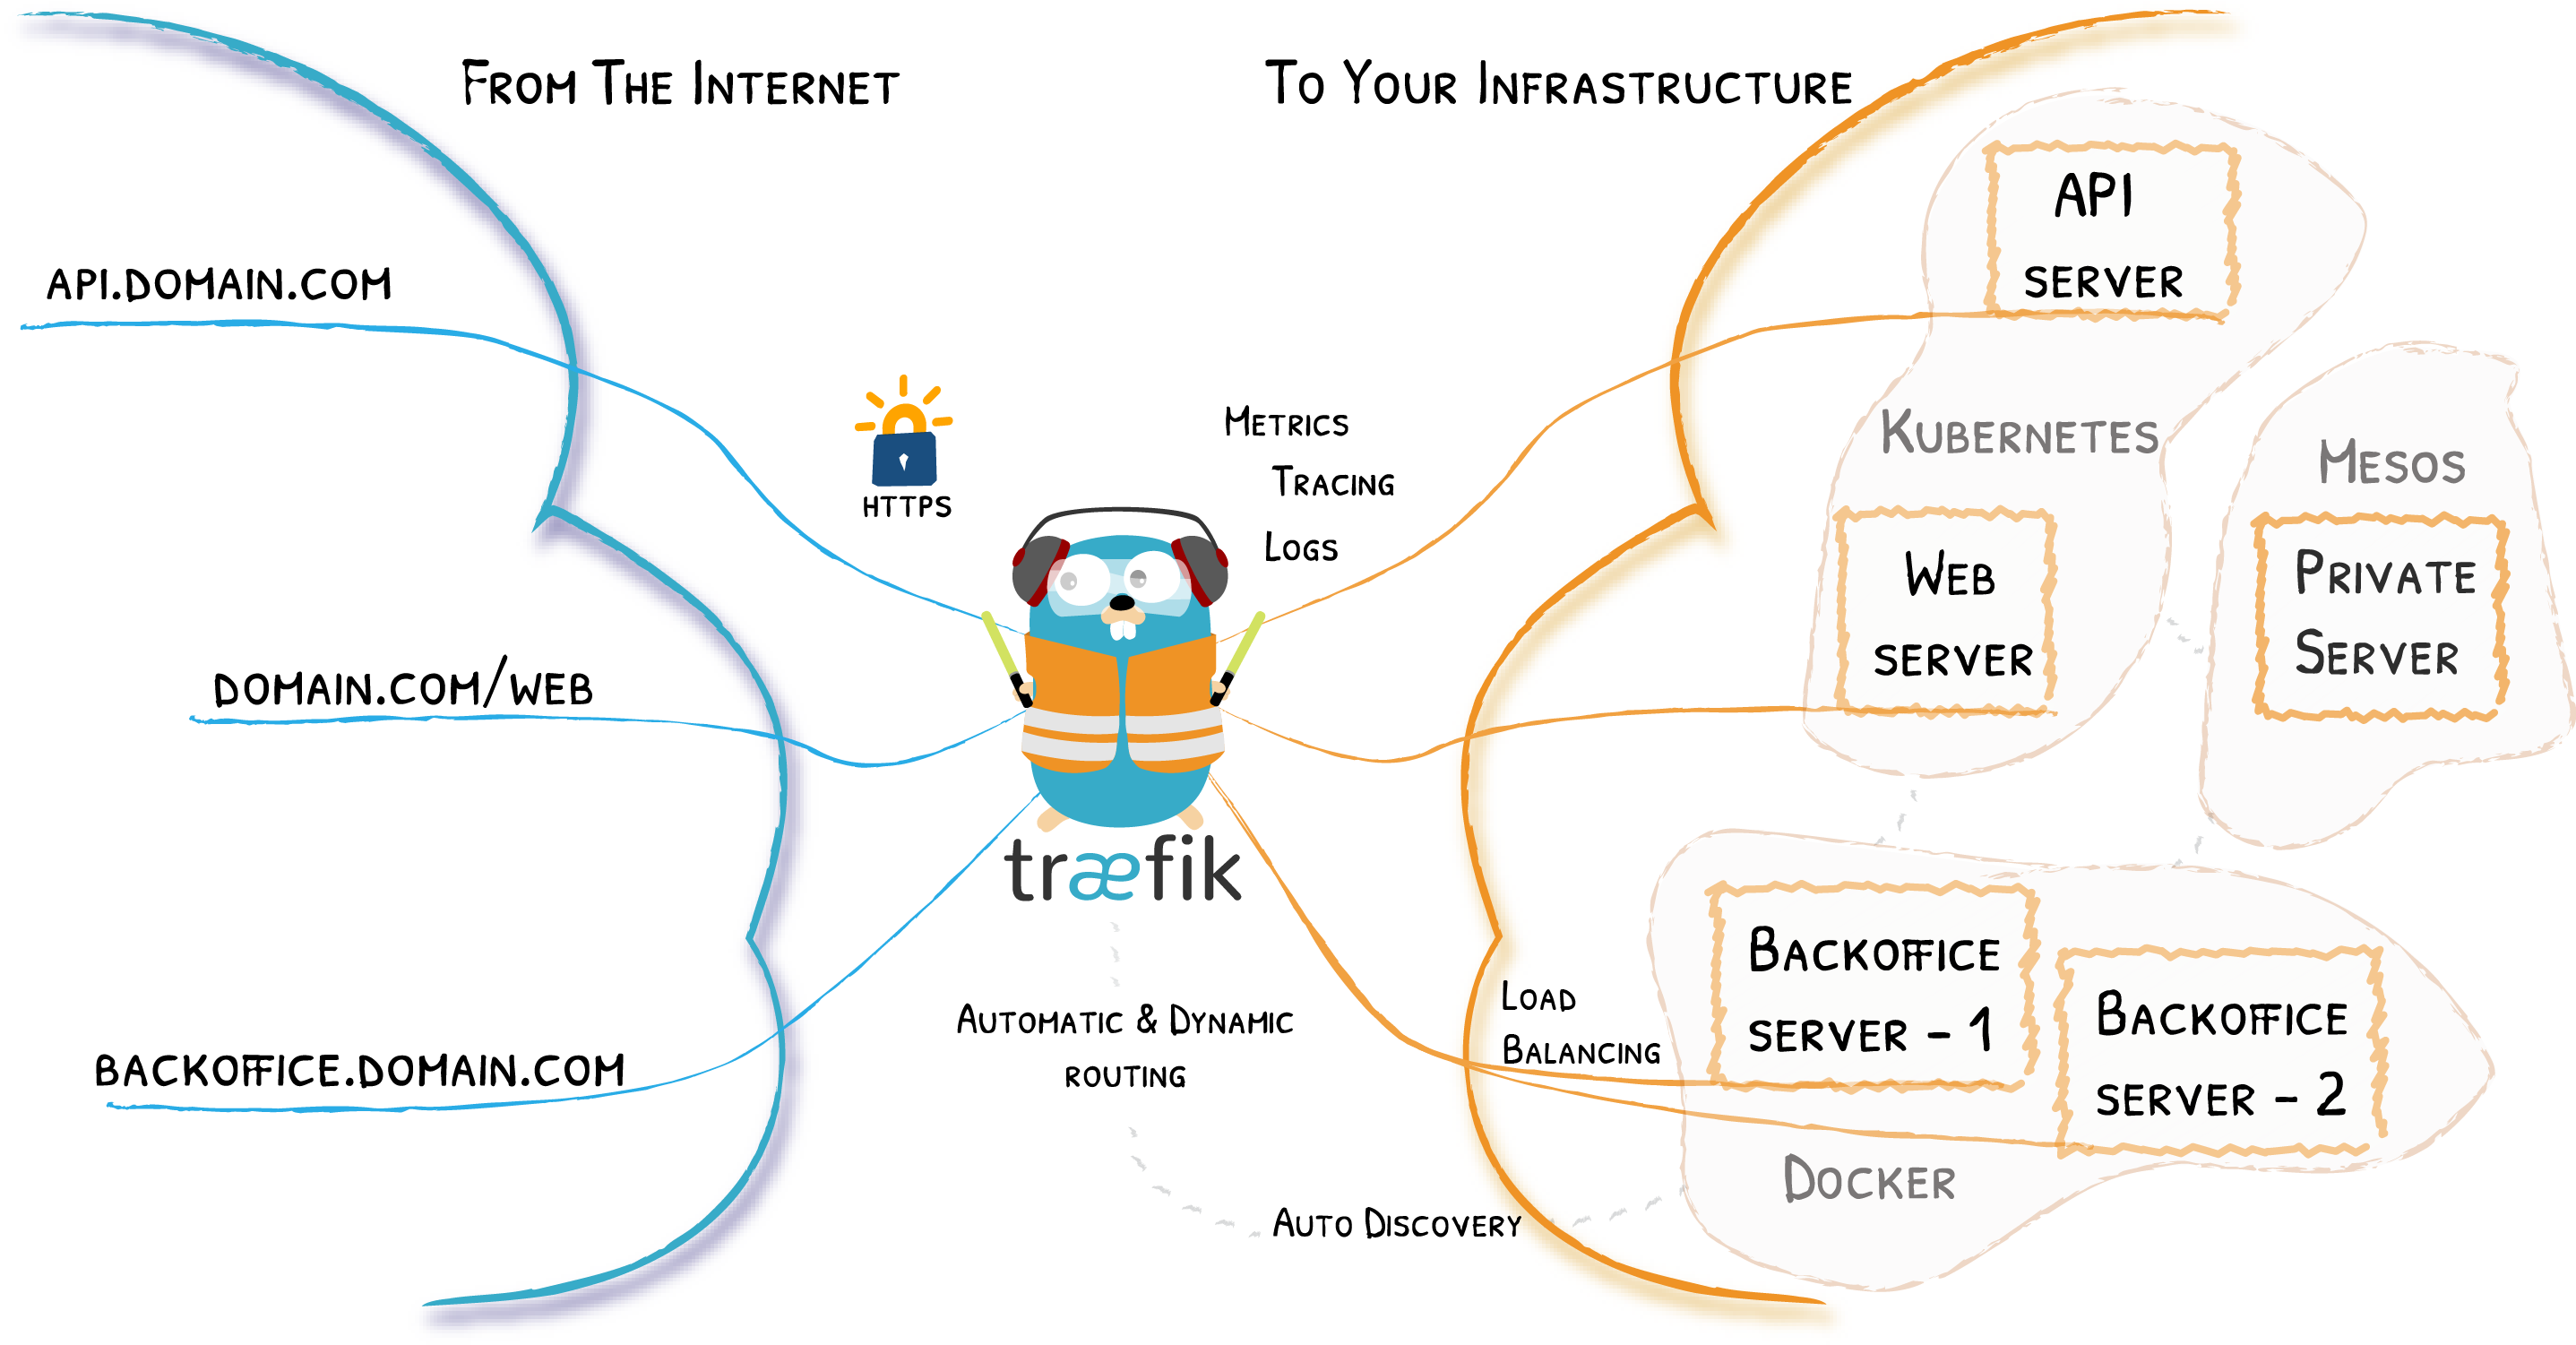
Traefik is an open-sourceEdge Router that makes publishing your services a fun and easy experience. It receives requests on behalf of your system and finds out which components are responsible for handling them.
What sets Traefik apart, besides its many features, is that it automatically discovers the right configuration for your services. The magic happens when Traefik inspects your infrastructure, where it finds relevant information and discovers which service serves which request.
Traefik is natively compliant with every major cluster technology, such as Kubernetes, Docker, Docker Swarm, AWS, Mesos, Marathon, and the list goes on; and can handle many at the same time. (It even works for legacy software running on bare metal.)
Why Traefik…
I needed an advanced reverse proxy for my lab that could cover all kinds of backends, from Kubernetes services, services running in regular workload such as virtual machines. I wanted it to be highly available and to solve one of my challenges when exposing services on the the Internet with one public IP and multiple services using the same port. After some quick research I ended up with Traefik. I am not sure why I exactly landed on Traefik, it could have been Nginx or HAProxy just to mention some of the bigger ones out there, or was it the “Æ”? Traefik offers both paid Enterprise editions, and free open source alternatives. I did not want to use time on a product that has some basic features included in their free open source edition and as soon as I wanted a more advanced feature I had to upgrade to a enterprise solution. After some reading Traefik seemed to have all the features I wanted in their open source product Traefik Proxy.
I decided to write this post as I wanted to document all the configurations I have done so far with Traefik. By searching in different forums, blog pages etc some say it is very easy to manage Traefik. I cant say I found it very easy to begin with, but as with everything new one need to learn how to master it. The official Traefik documentation is very good at describing and explaining all the possibilites with Traefik, but several times I was missing some “real life” example configs. But with the help of the great community out there I managed to solve the challenges I had and make them work with Traefik. So thanks to all the blog pages, forums with people asking questions and people willing to answer and explain. This is much appreciated as always.
So lets begin this post wth some high level explanations on some terminology used in Traefik, then the installation and how I have configured Traefik to serve as a reverse proxy for some of my services.
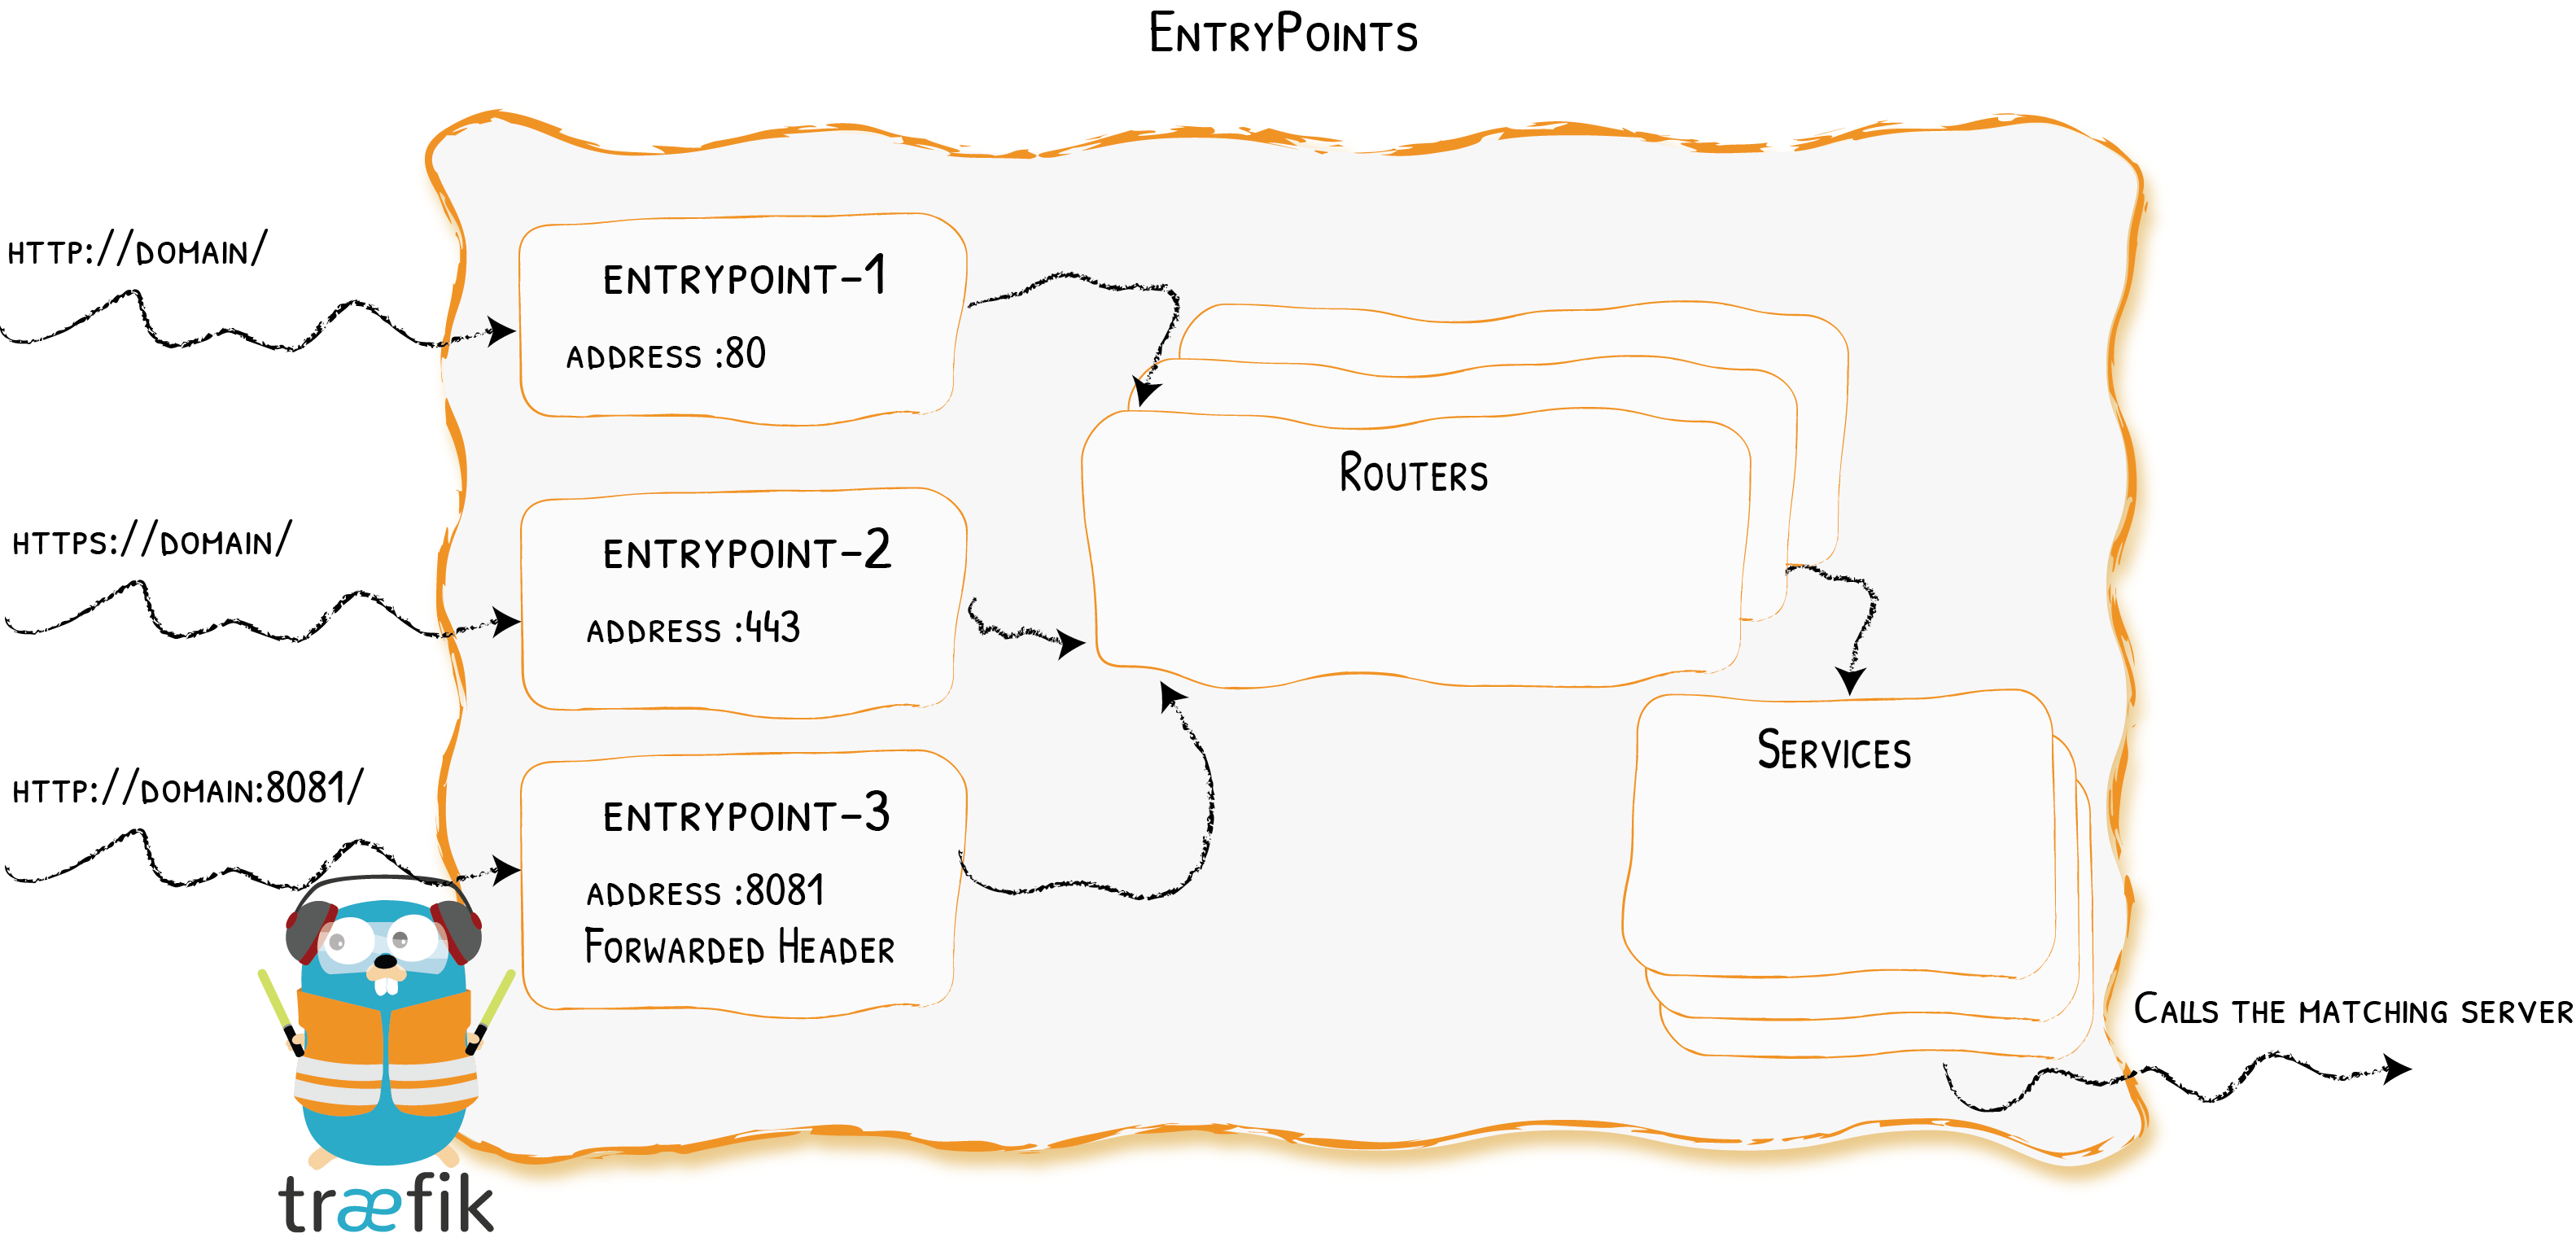
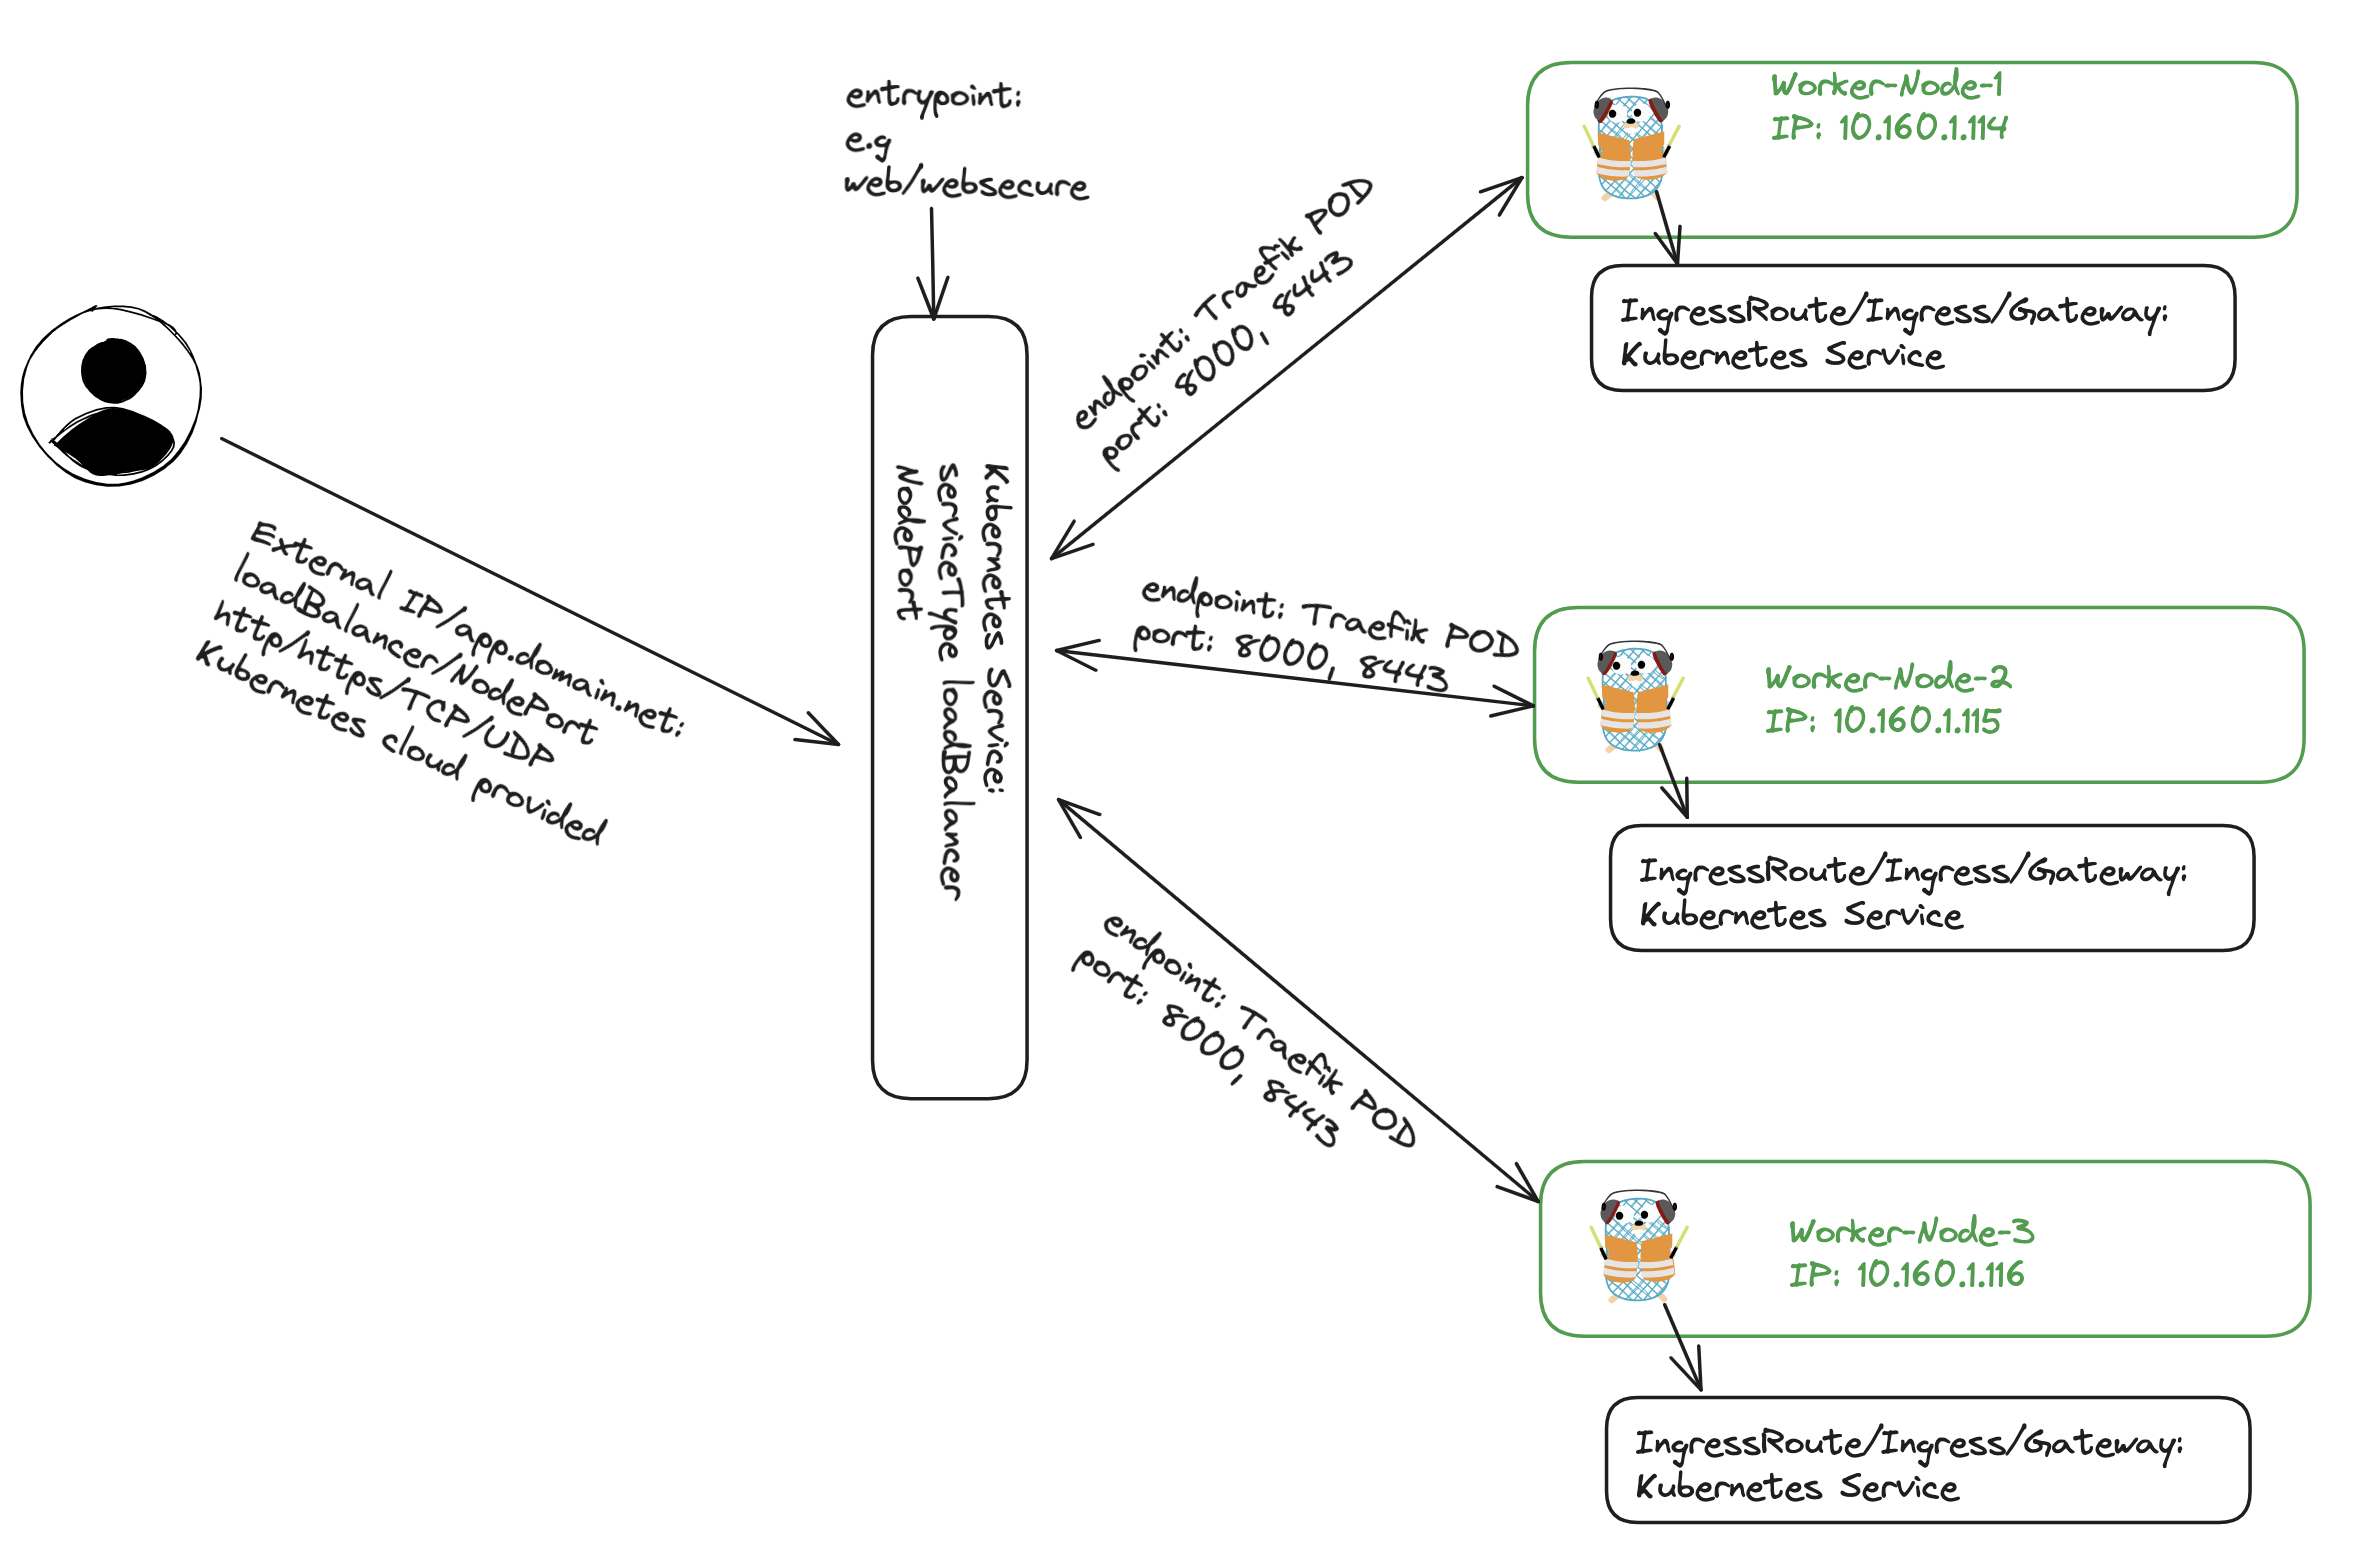
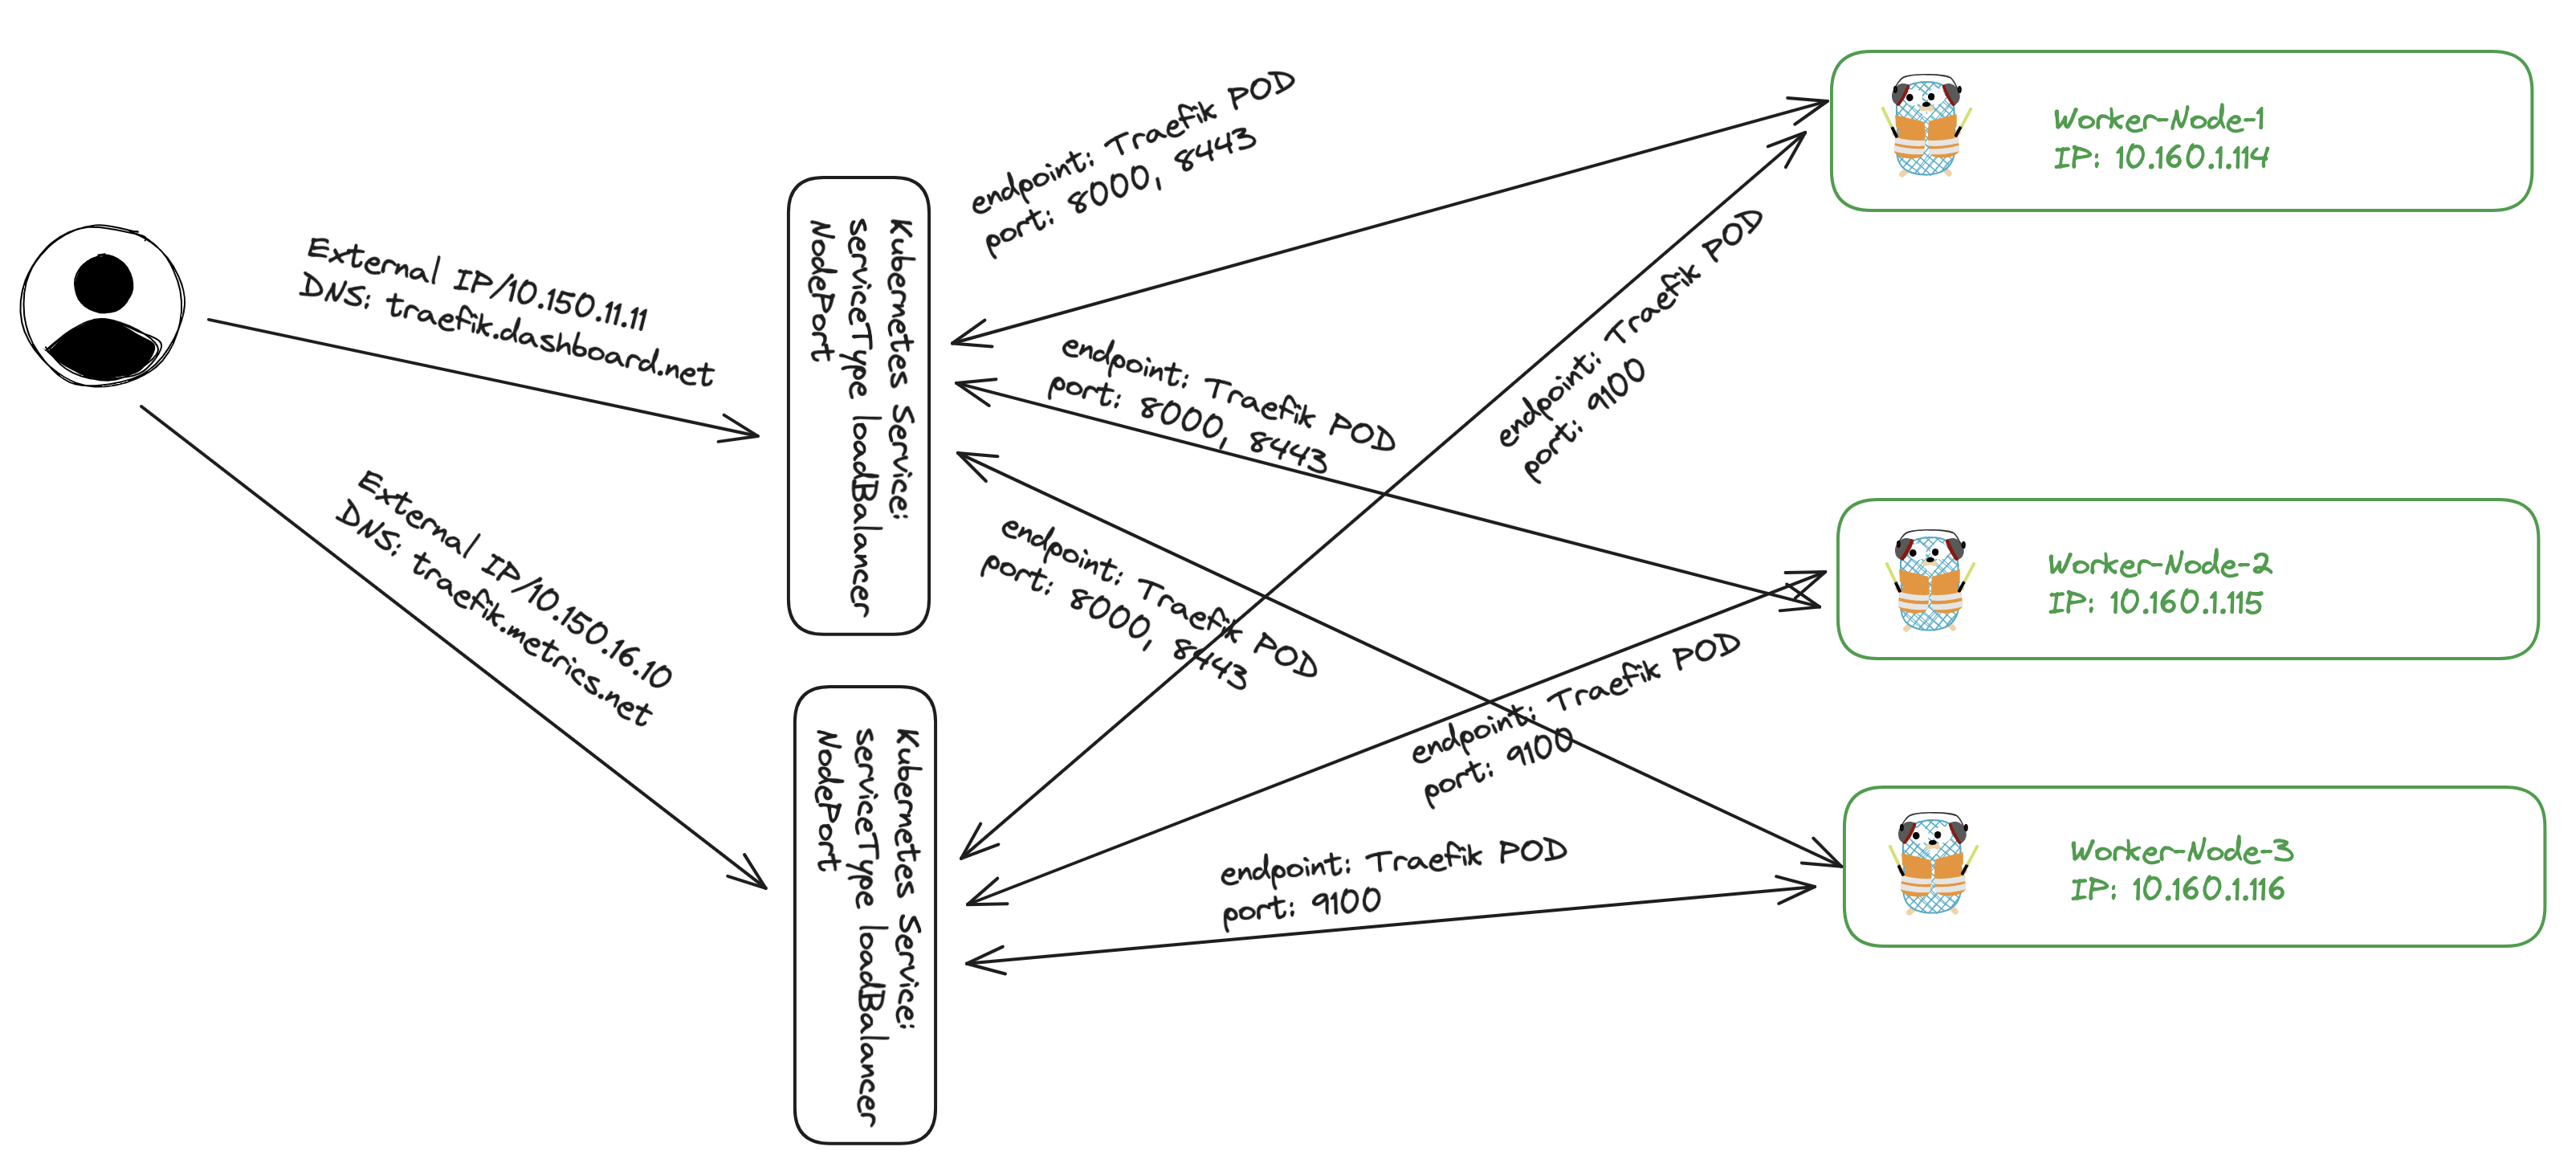
EntryPoints are the network entry points into Traefik. They define the port which will receive the packets, and whether to listen for TCP or UDP.
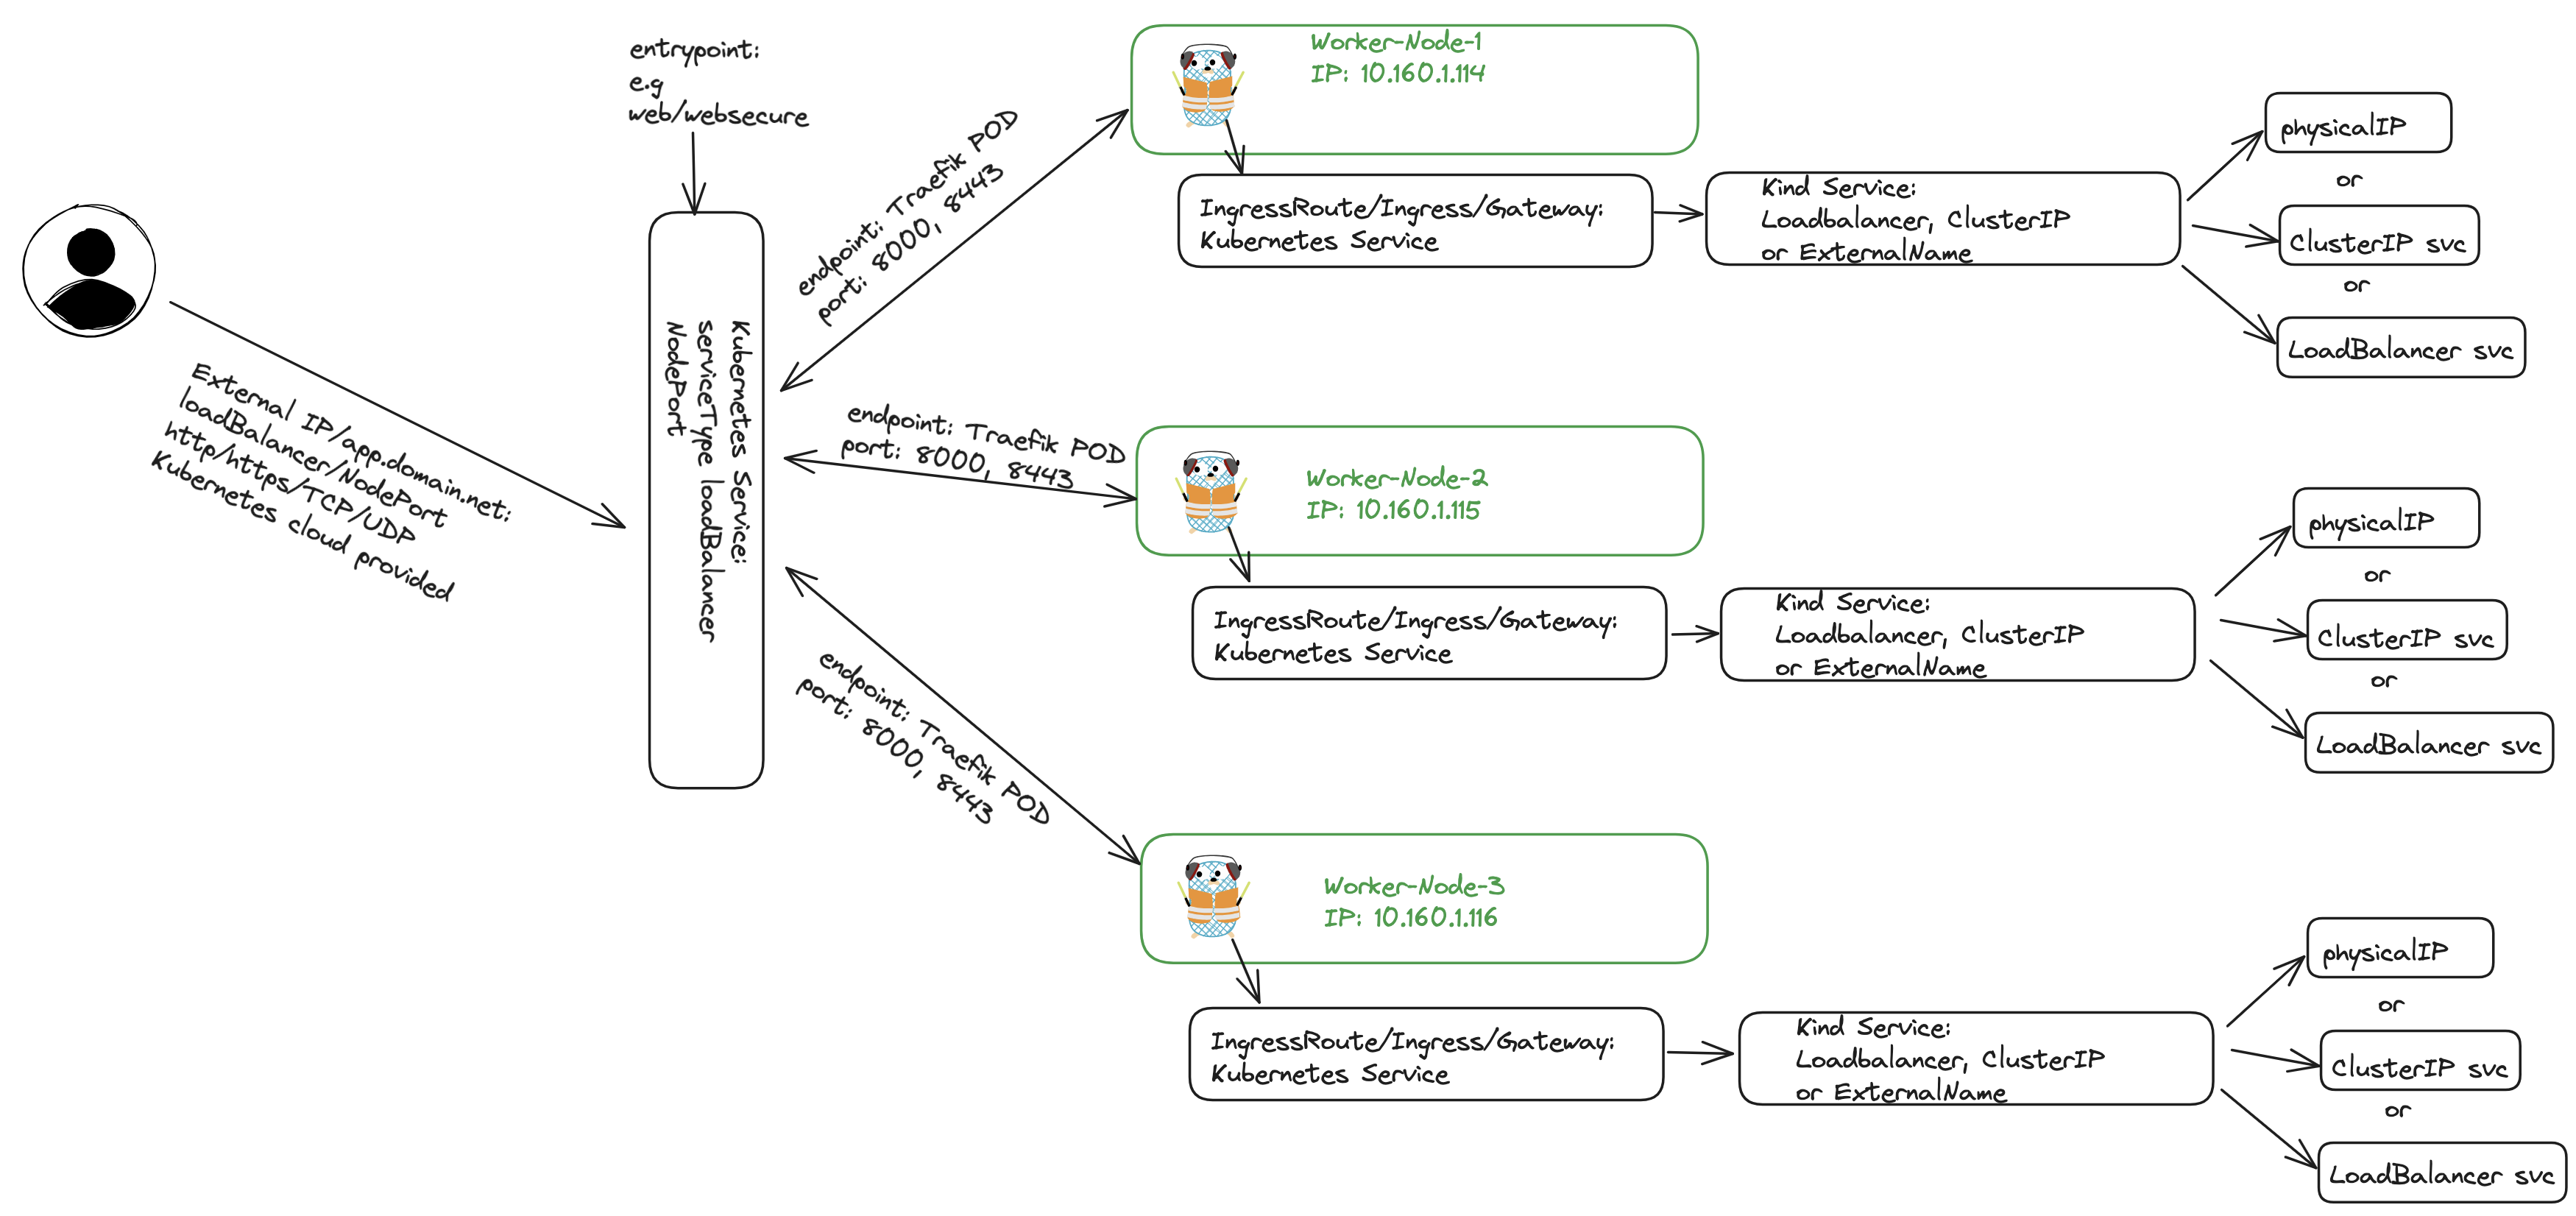
In other words either an externally exposed service (NodePort or loadBalancer) or internal service (ClusterIP) defined, the destination endpoints for these entrypoints will here be the Traefik pods responsible for listening to any requests coming their way and do something useful with the traffic if configured.
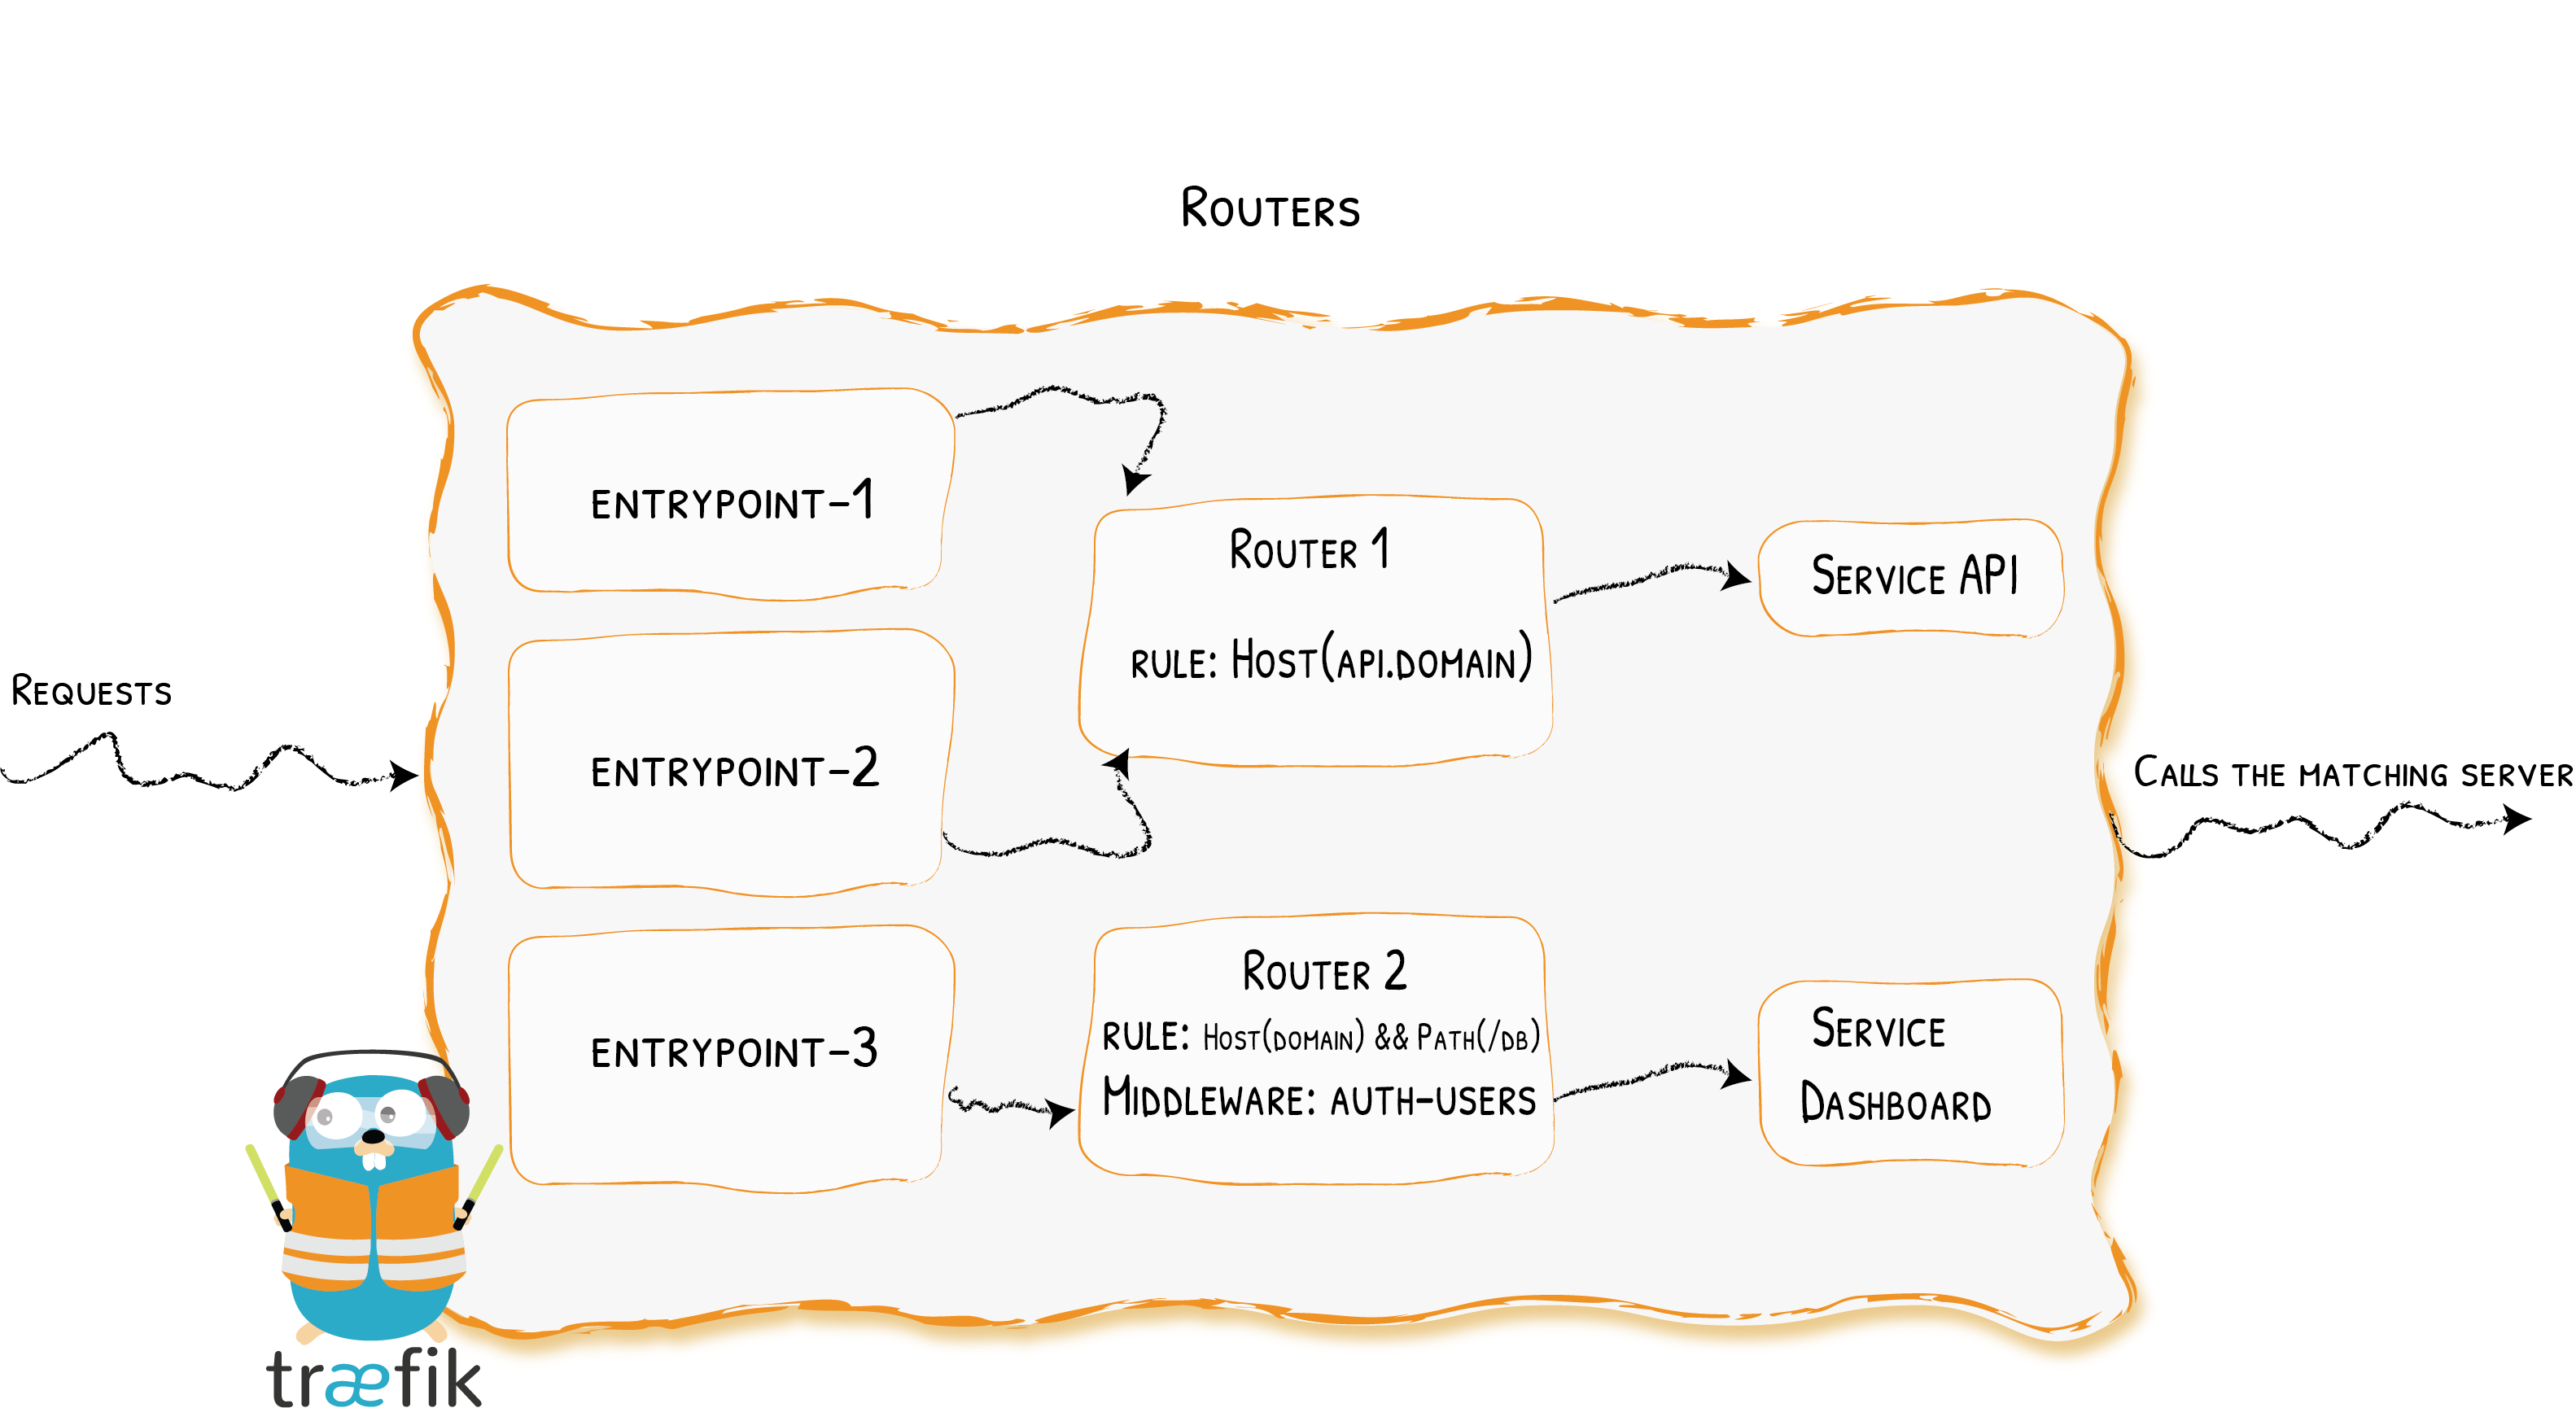
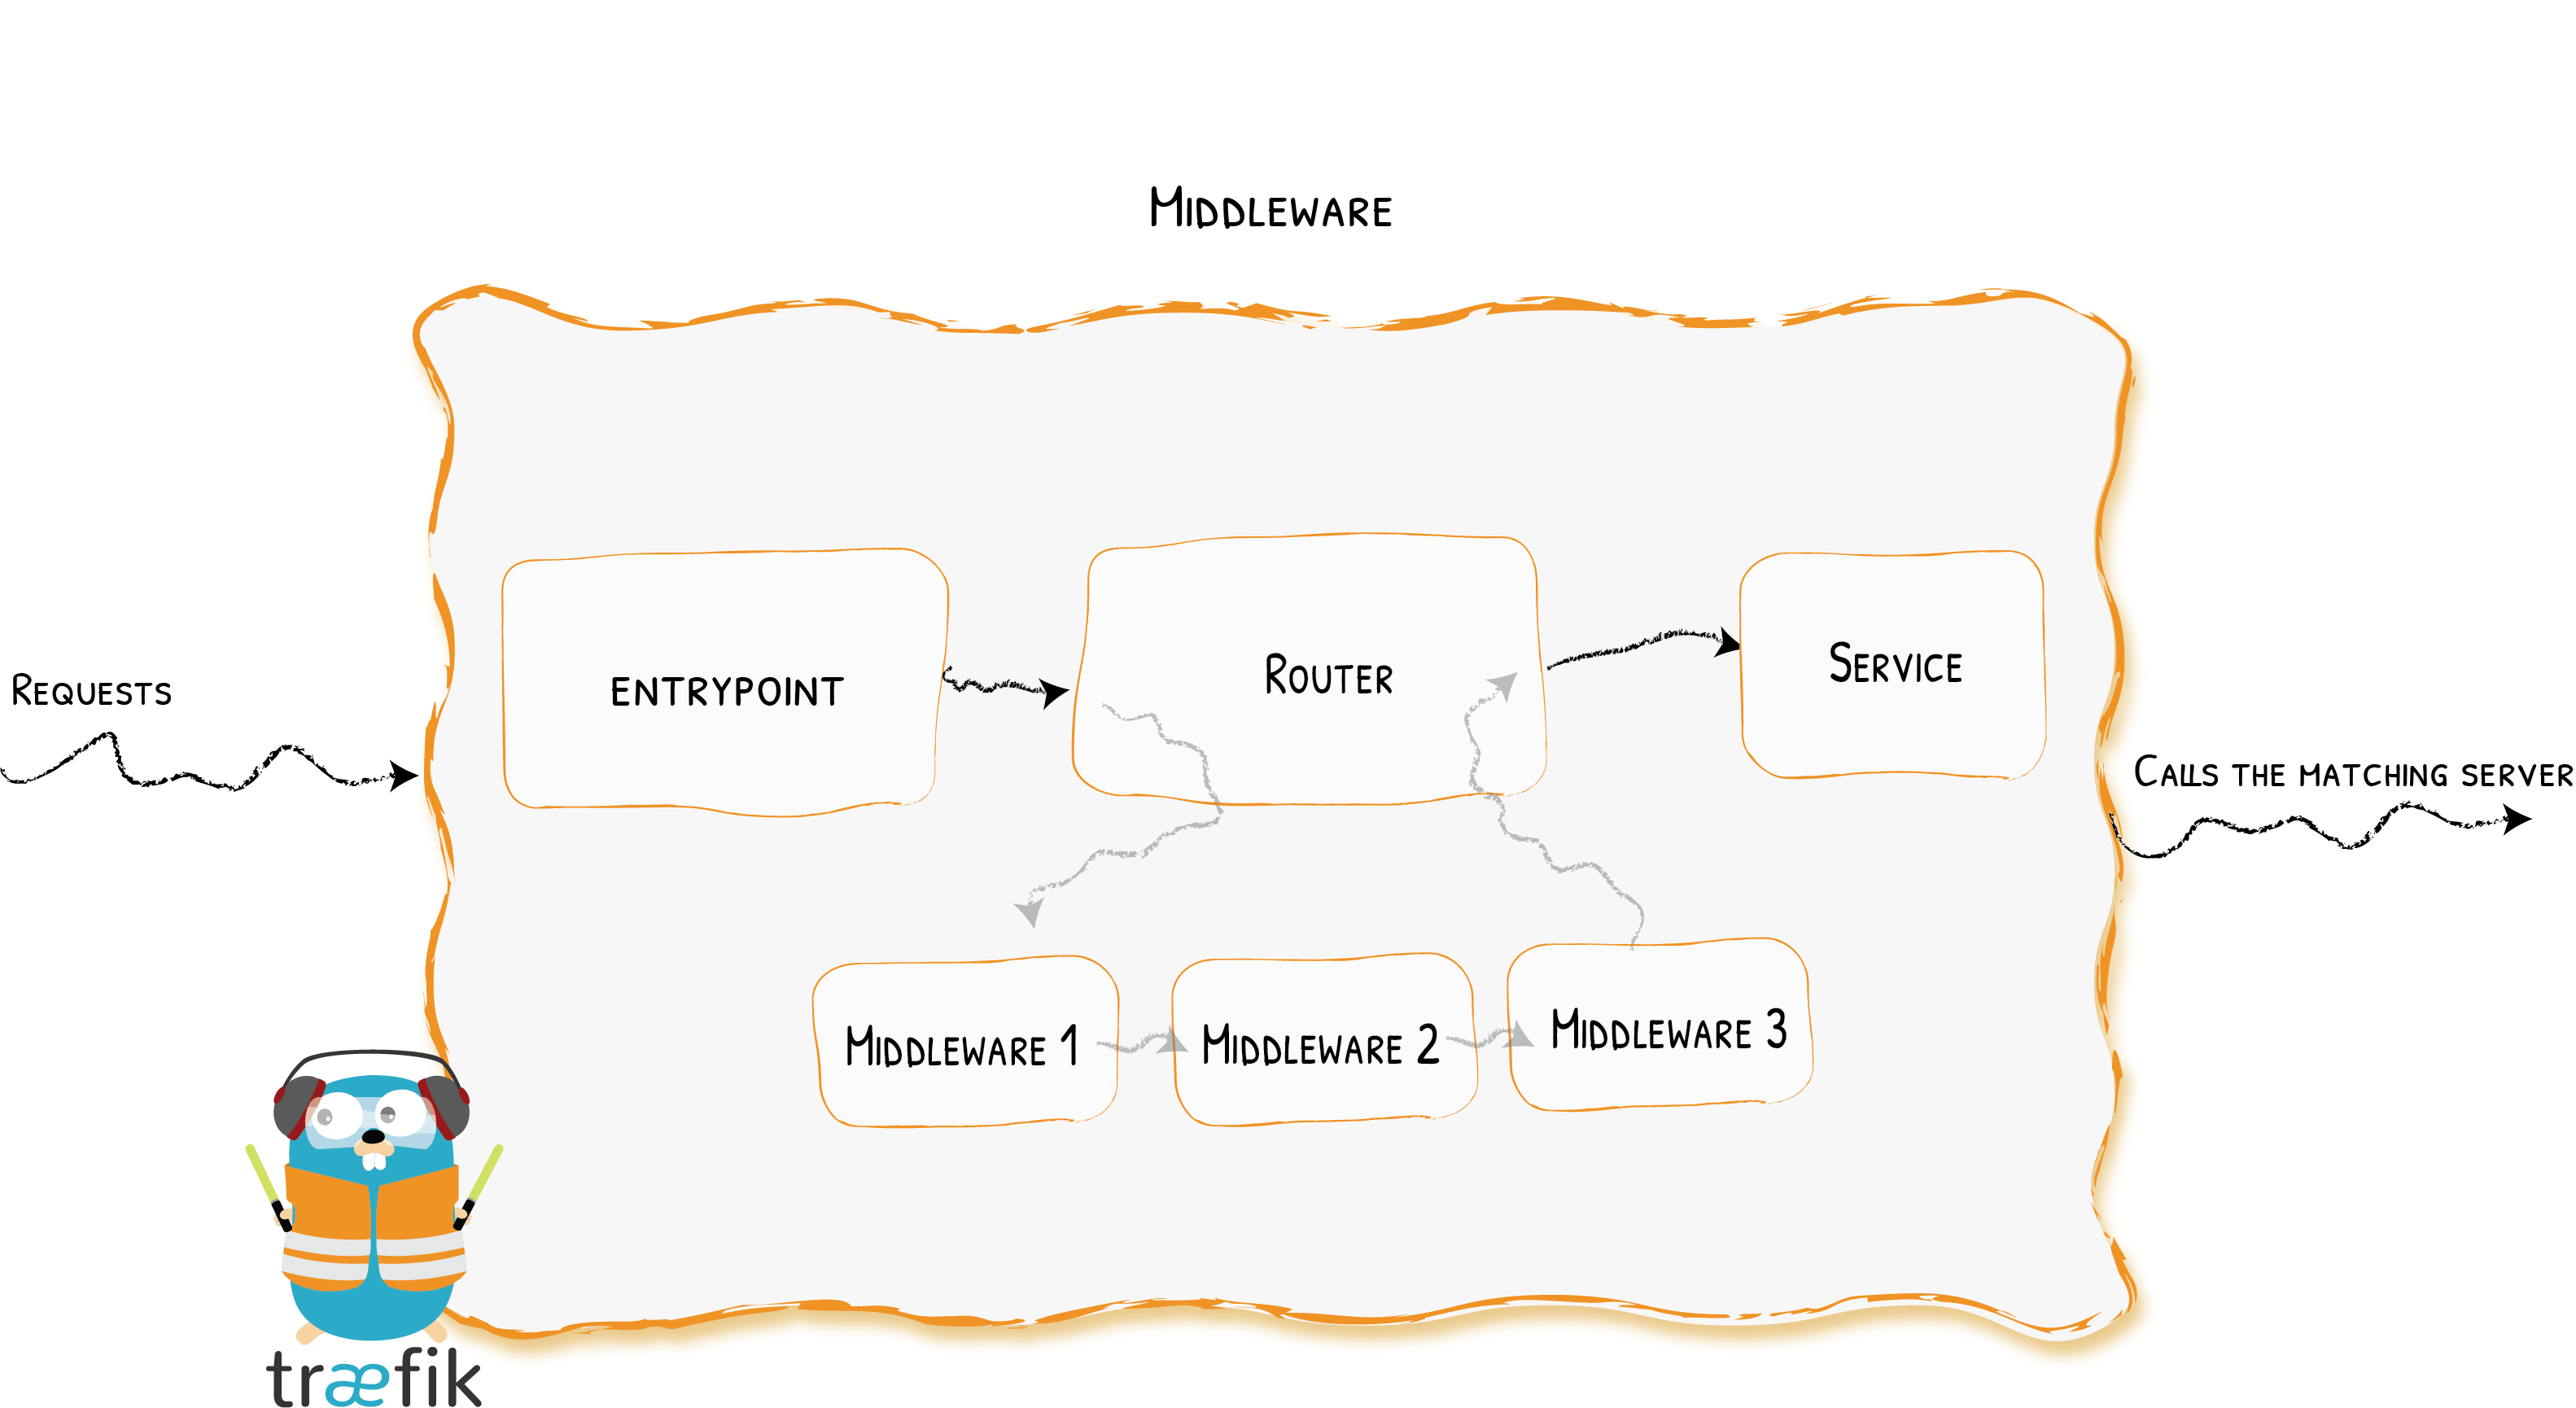
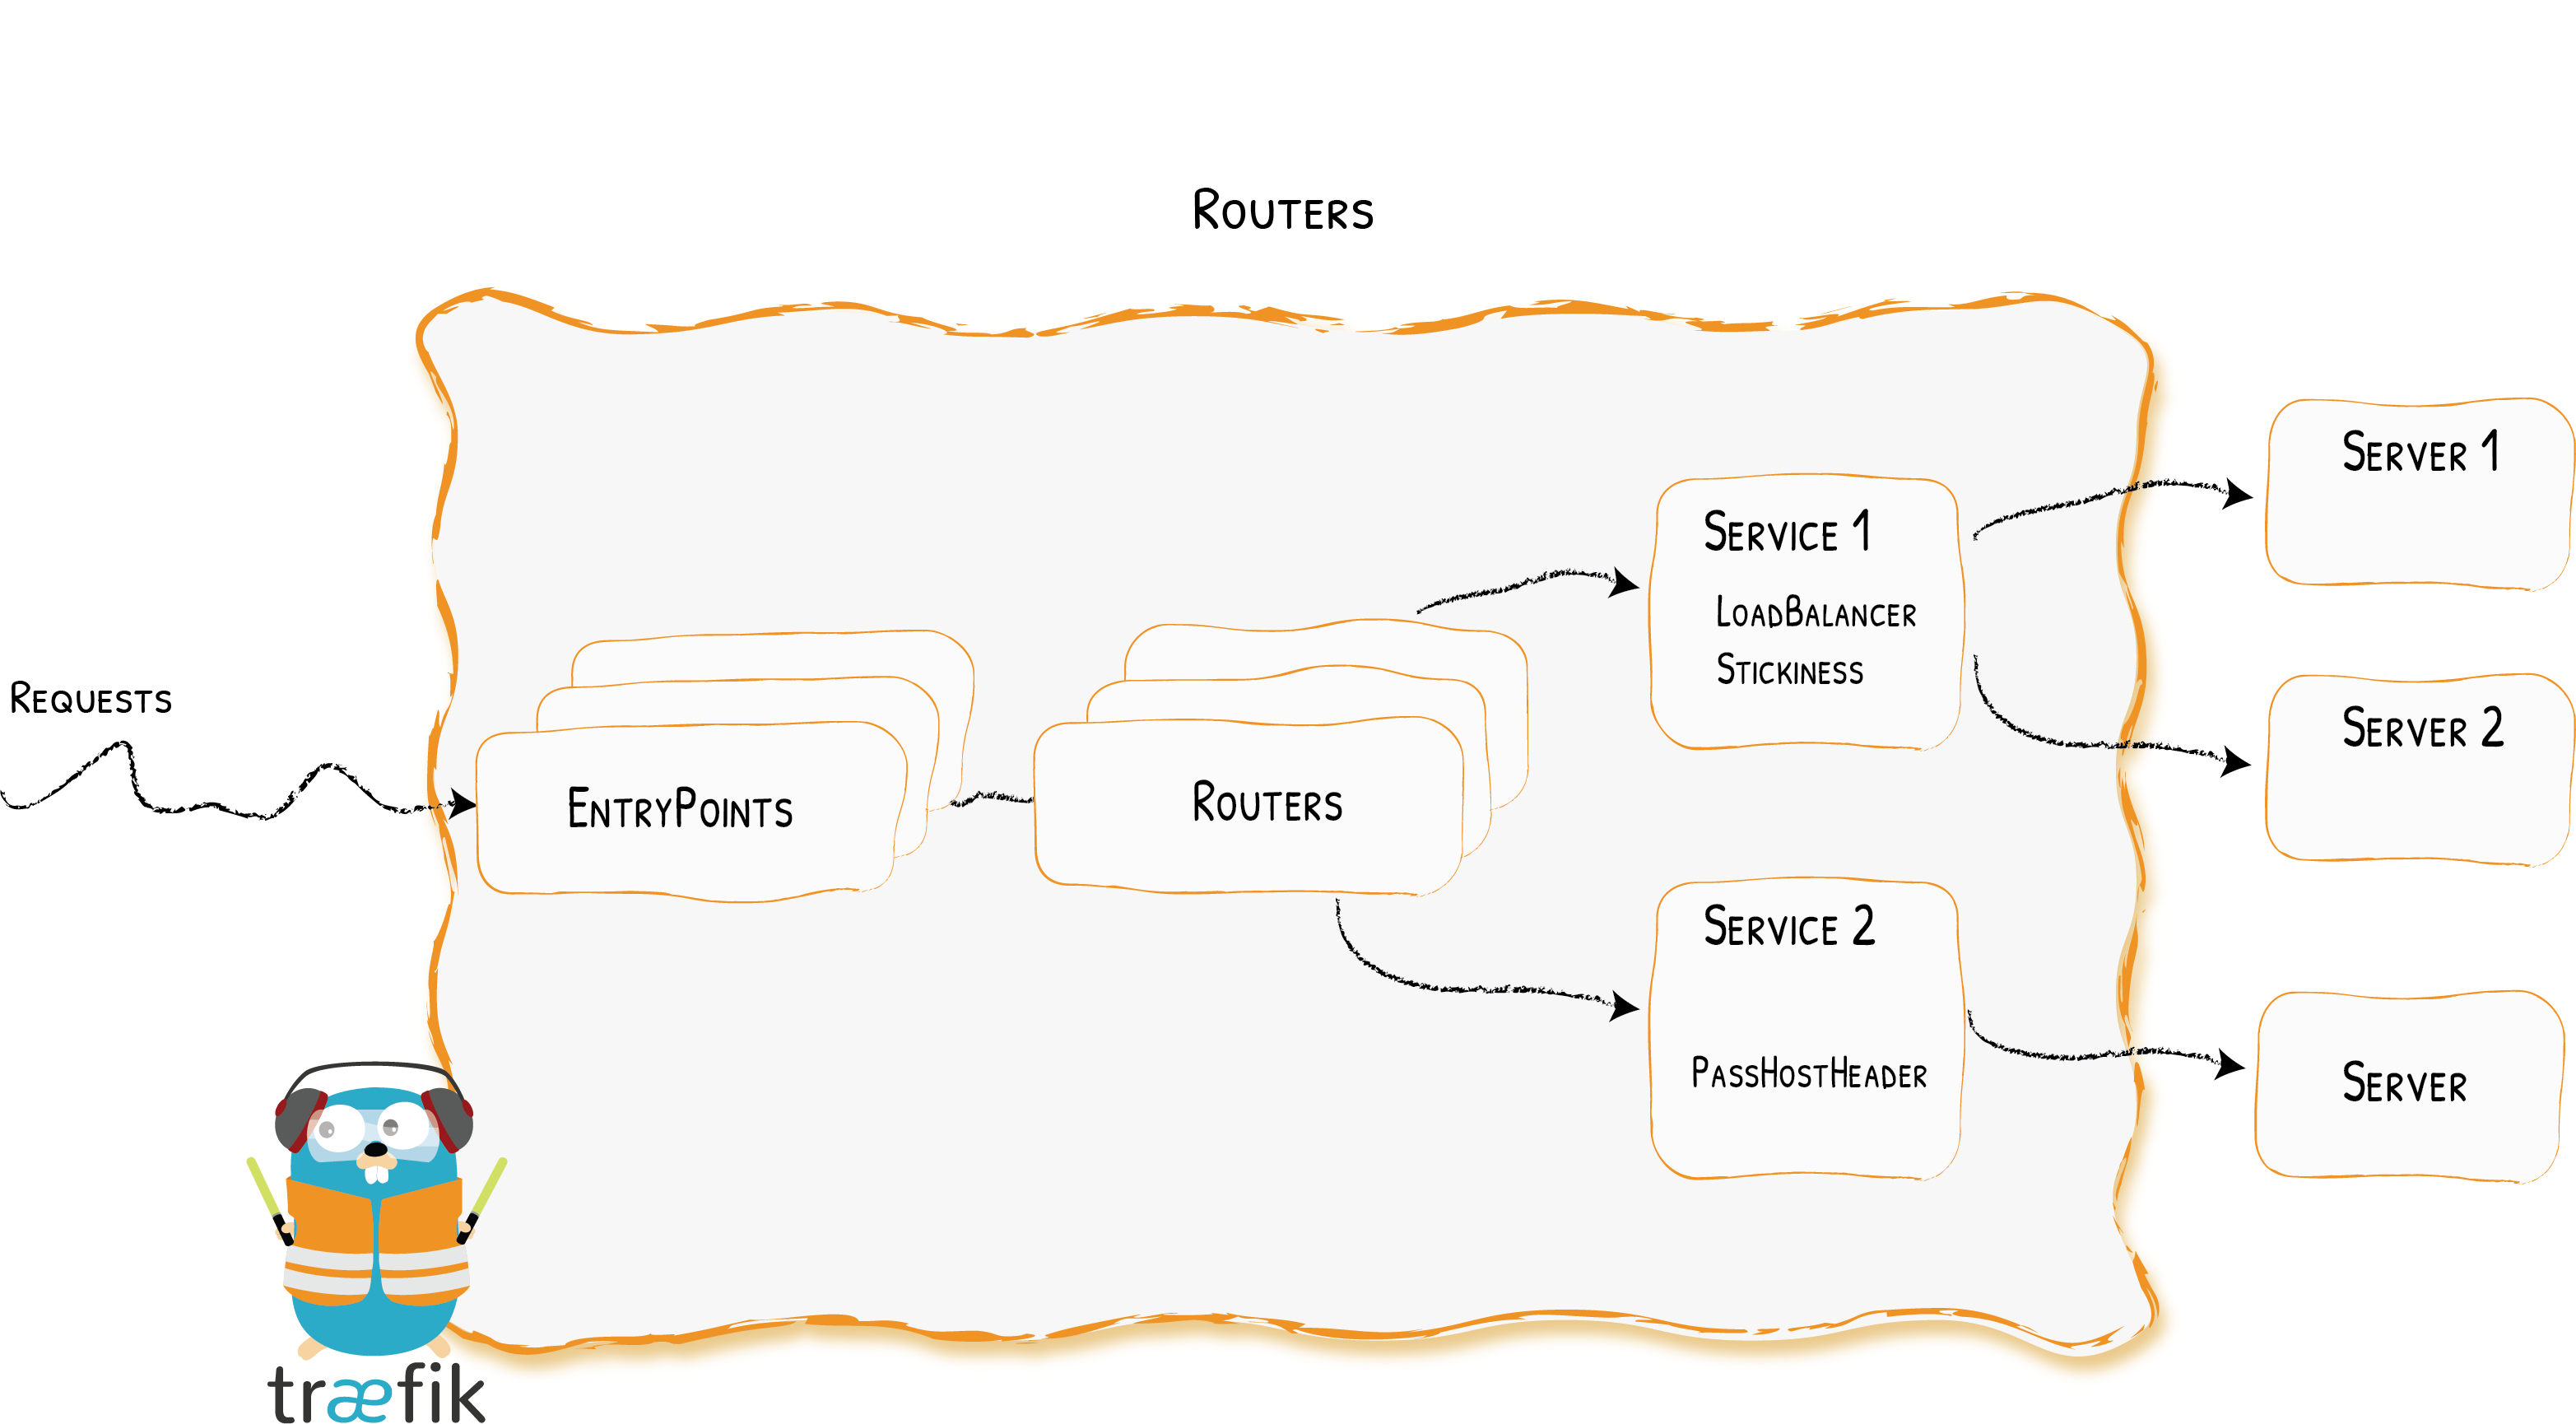
A router is in charge of connecting incoming requests to the services that can handle them. In the process, routers may use pieces of middleware to update the request, or act before forwarding the request to the service.
So this is the actual component that knows which service to forward the requests to based on for example host header.
Attached to the routers, pieces of middleware are a means of tweaking the requests before they are sent to your service (or before the answer from the services are sent to the clients).
An example can be the redirectscheme to redirect all http requests to https. For a full list of options, hava a look here
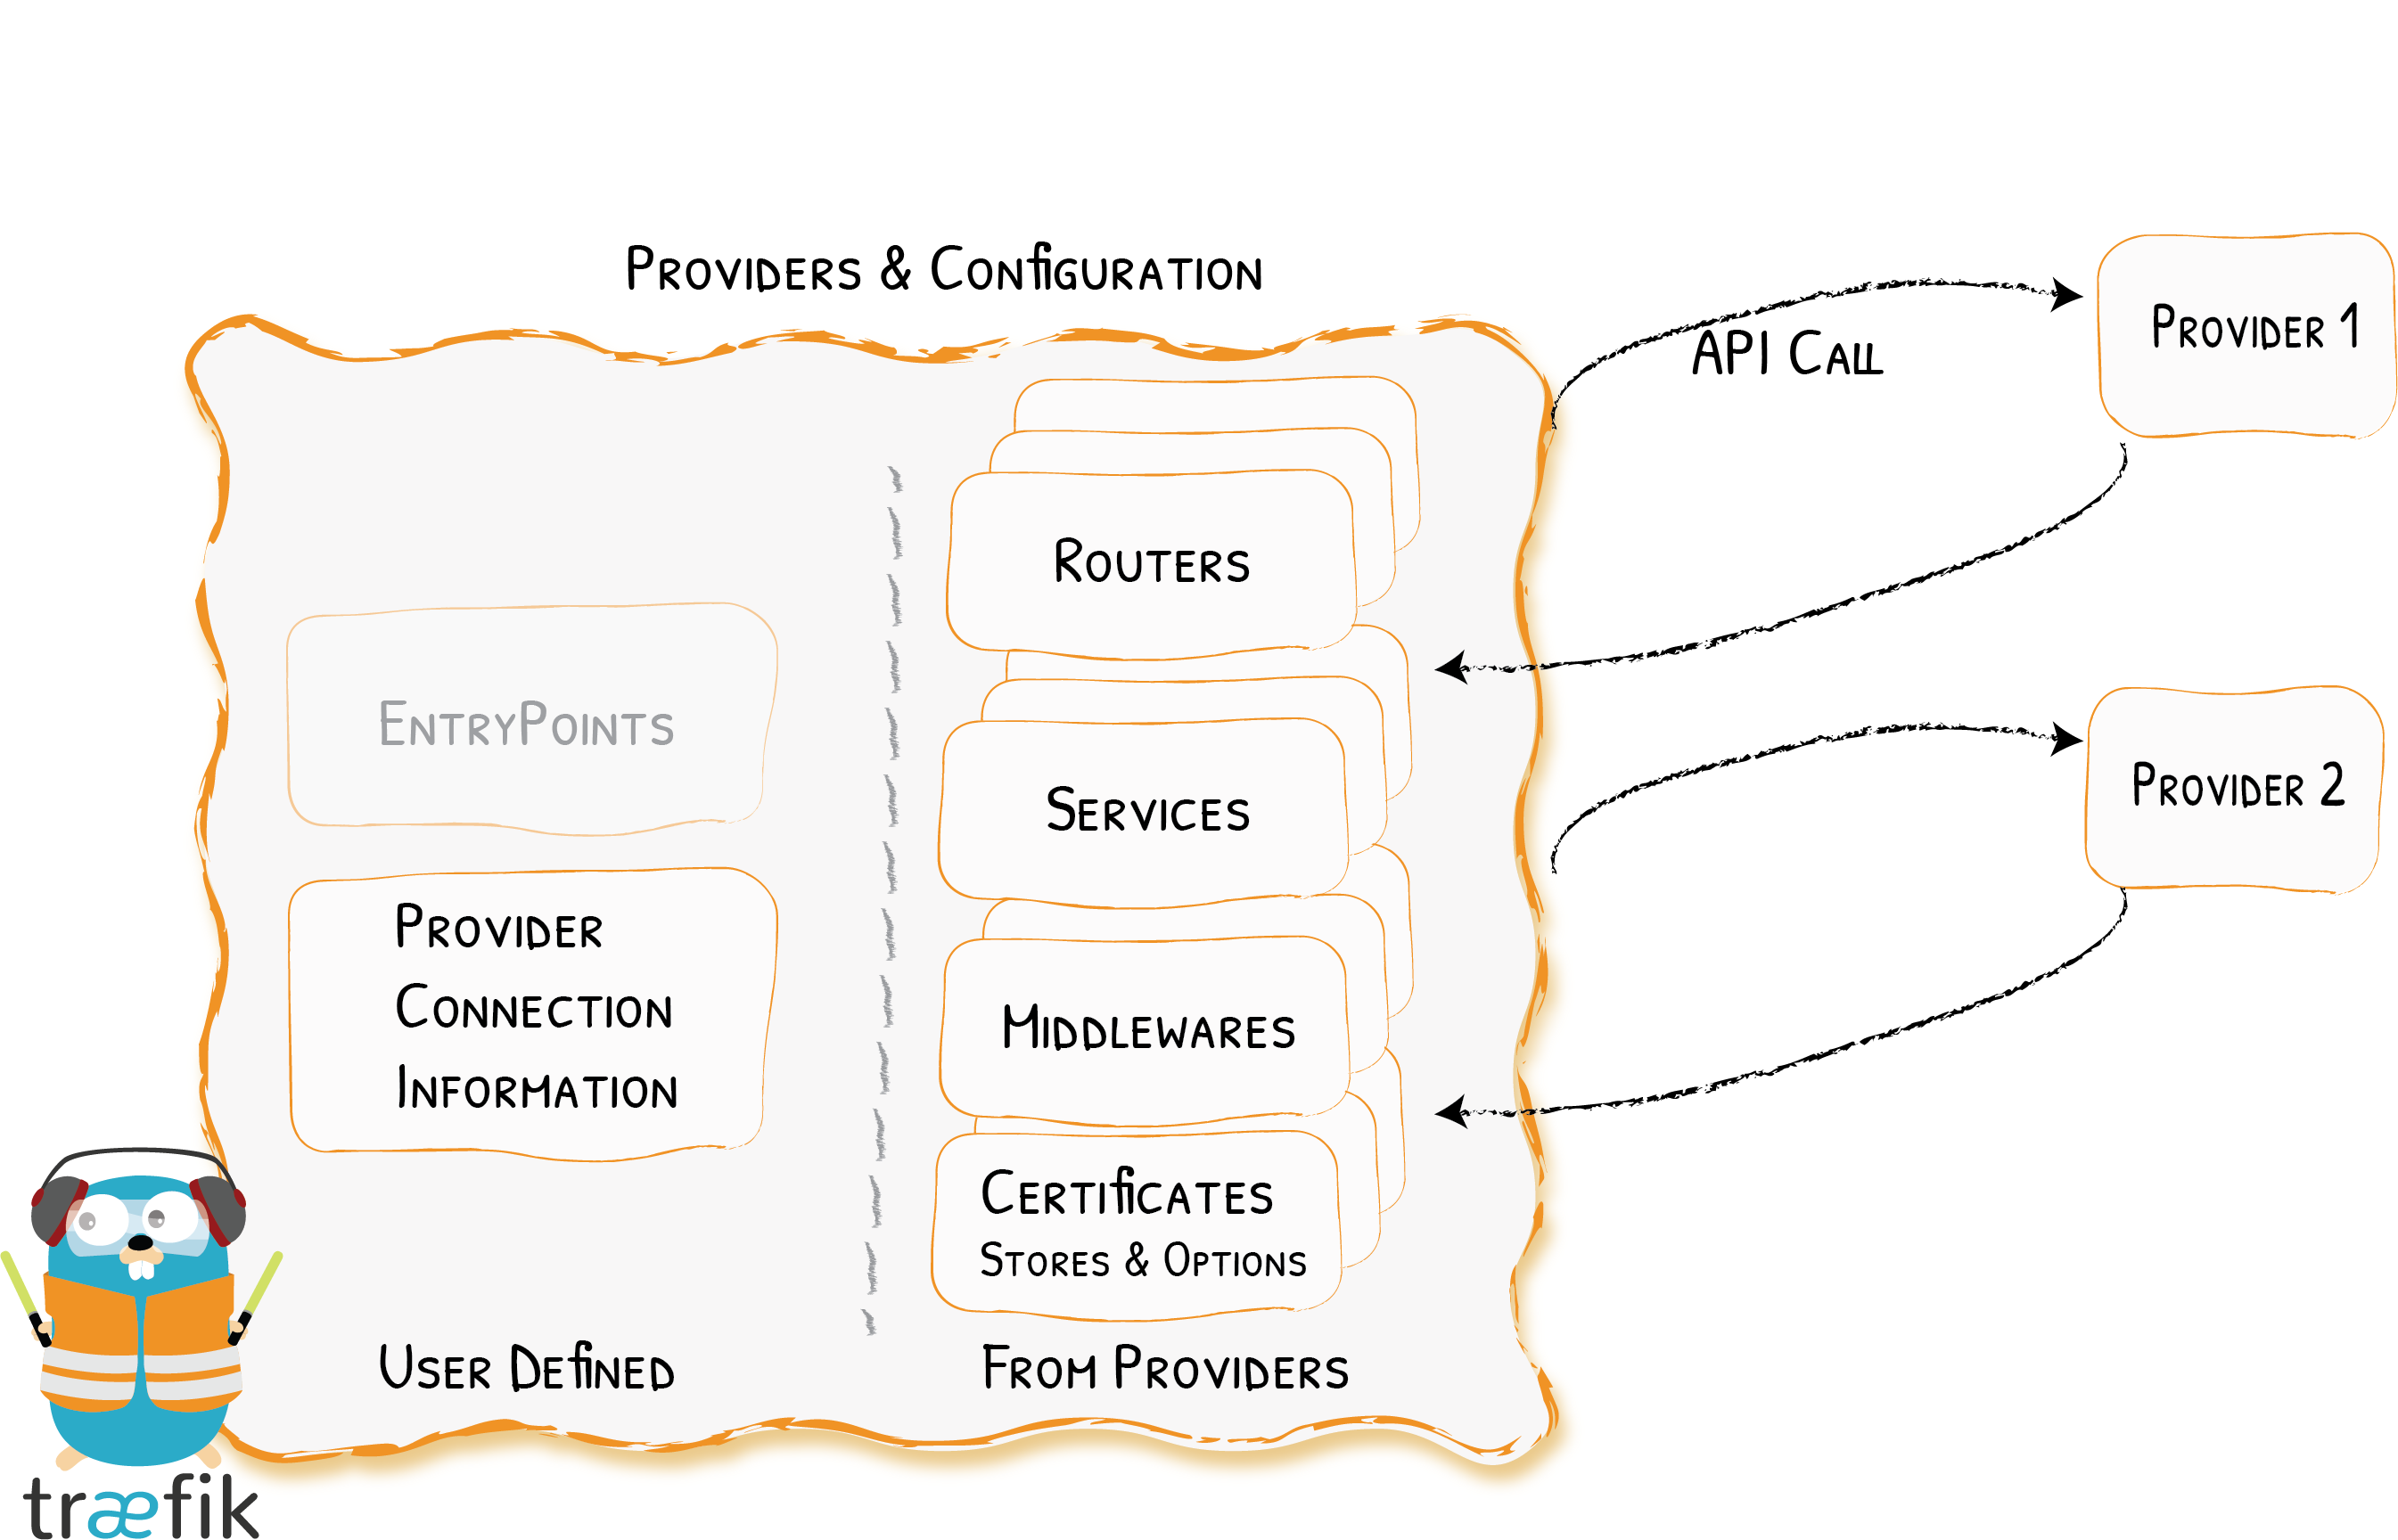
Configuration discovery in Traefik is achieved through Providers.
The providers are infrastructure components, whether orchestrators, container engines, cloud providers, or key-value stores. The idea is that Traefik queries the provider APIs in order to find relevant information about routing, and when Traefik detects a change, it dynamically updates the routes.
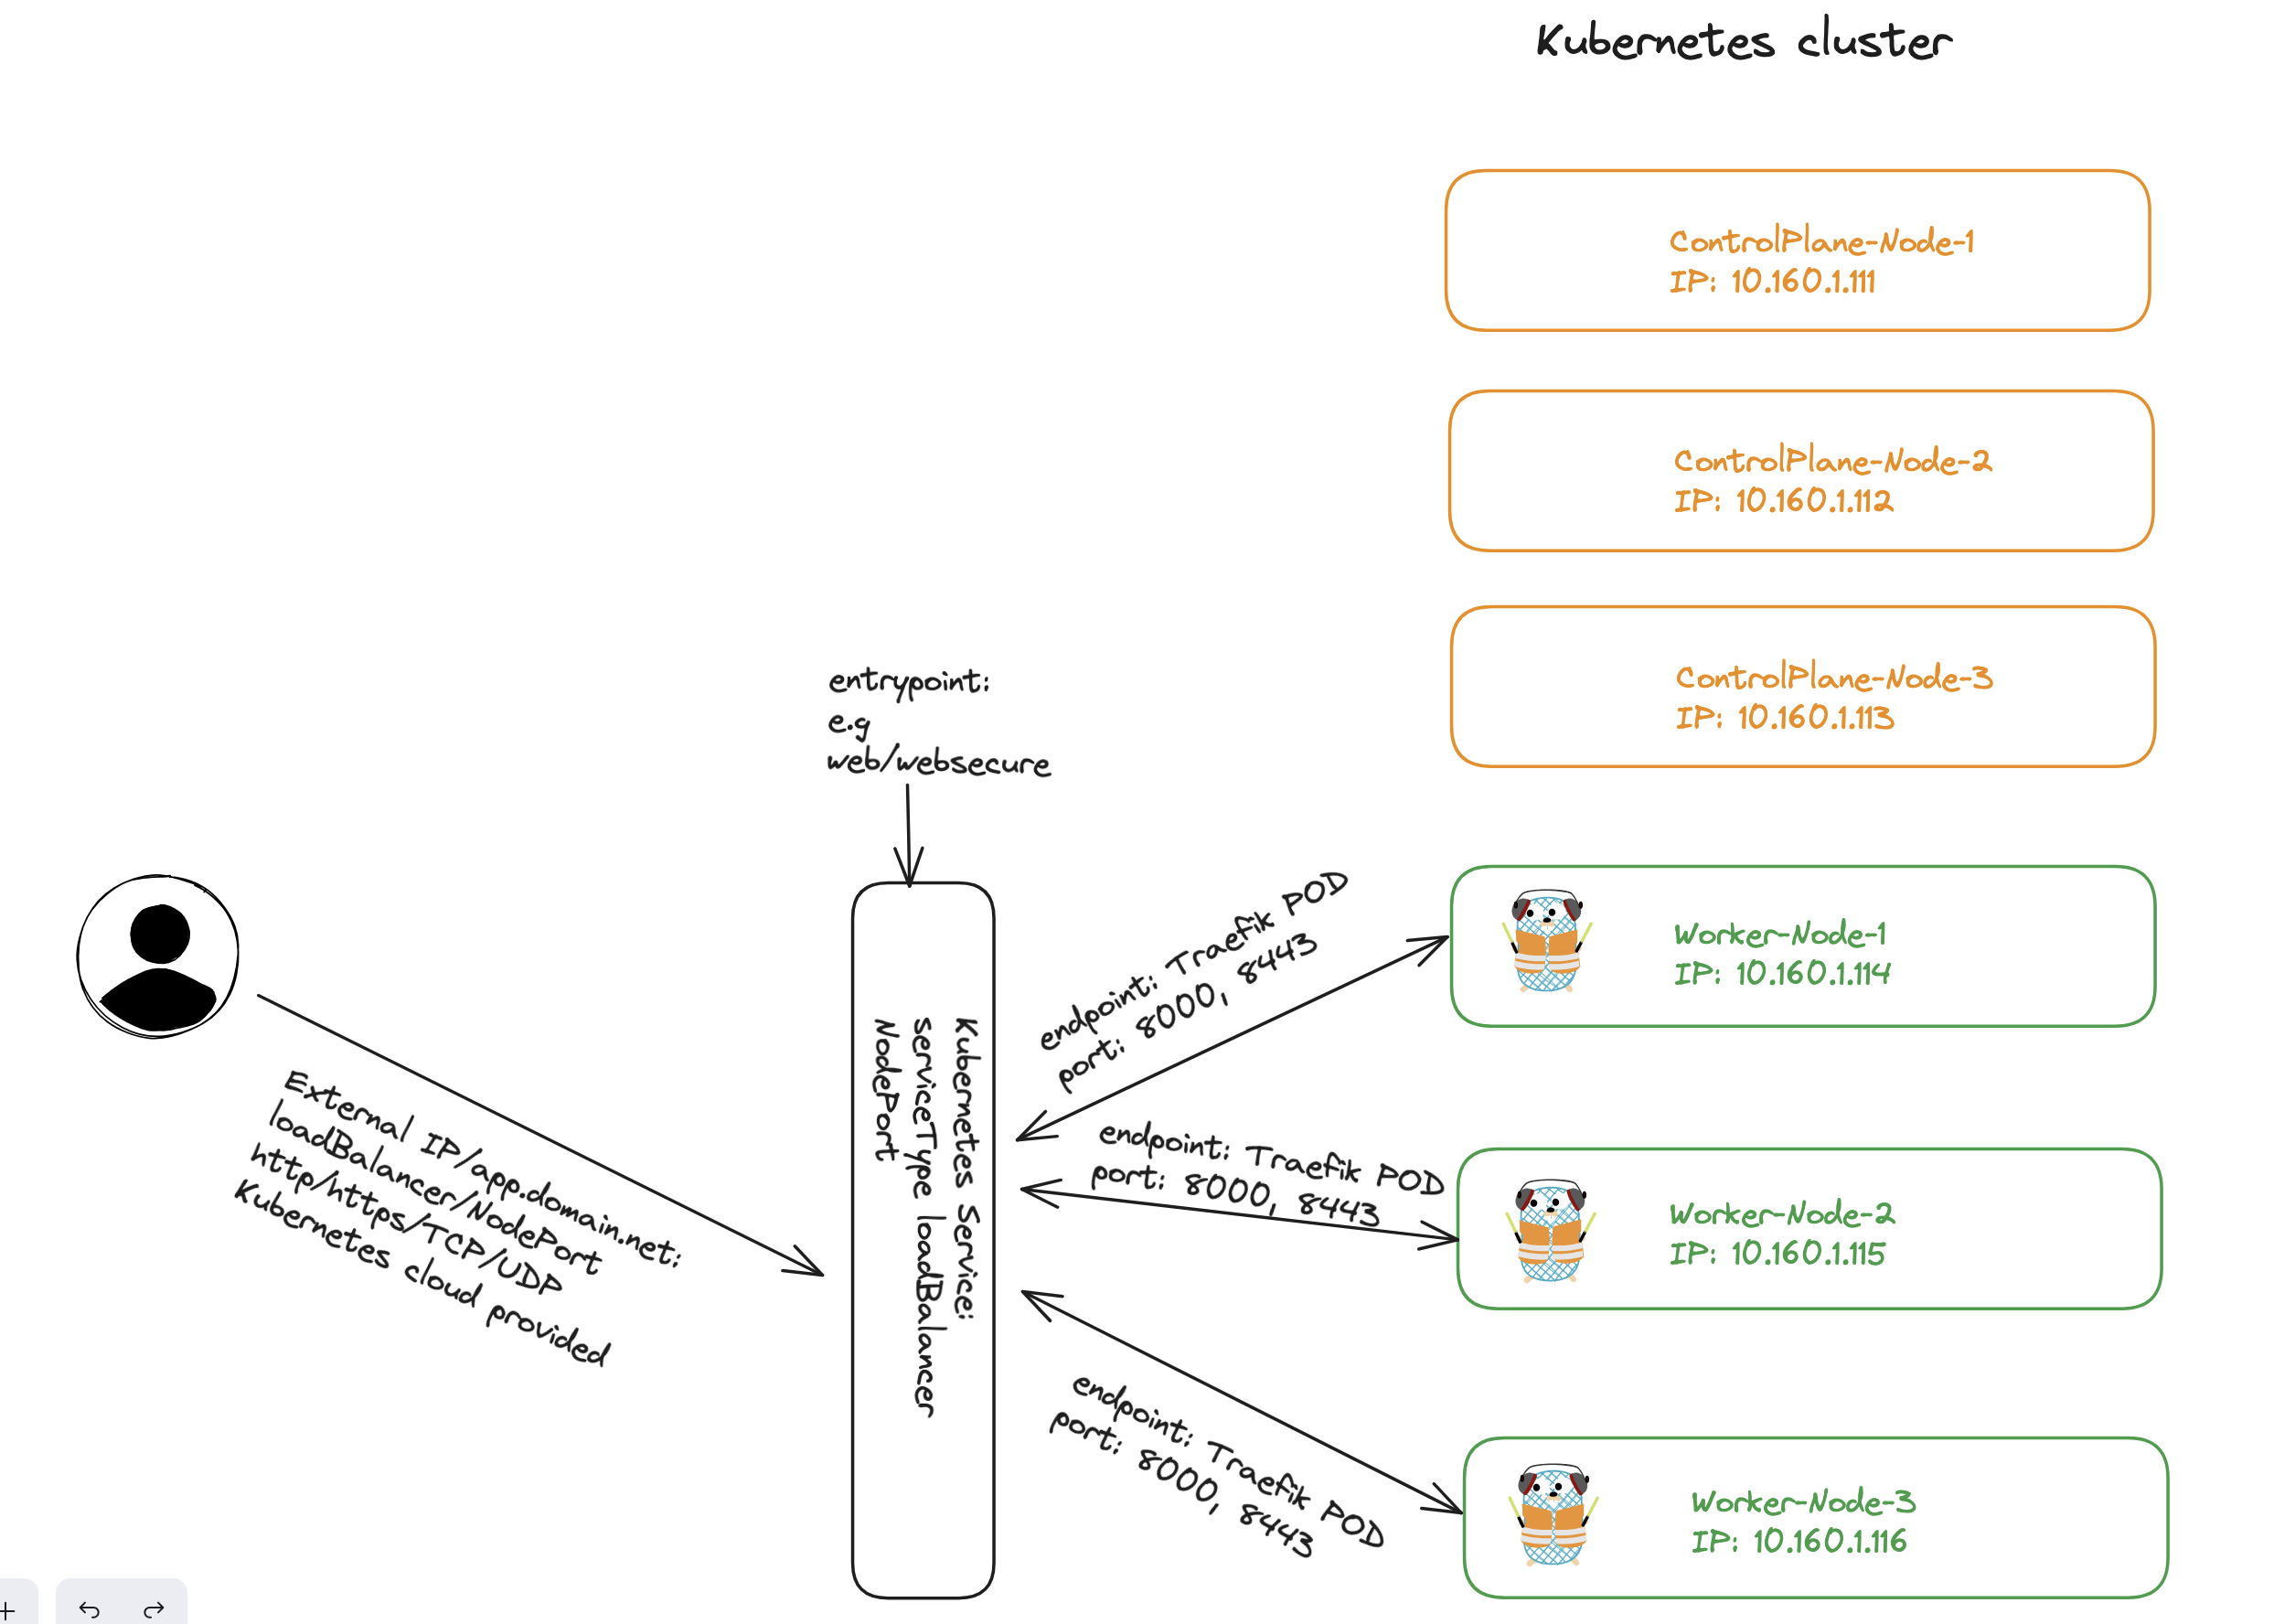
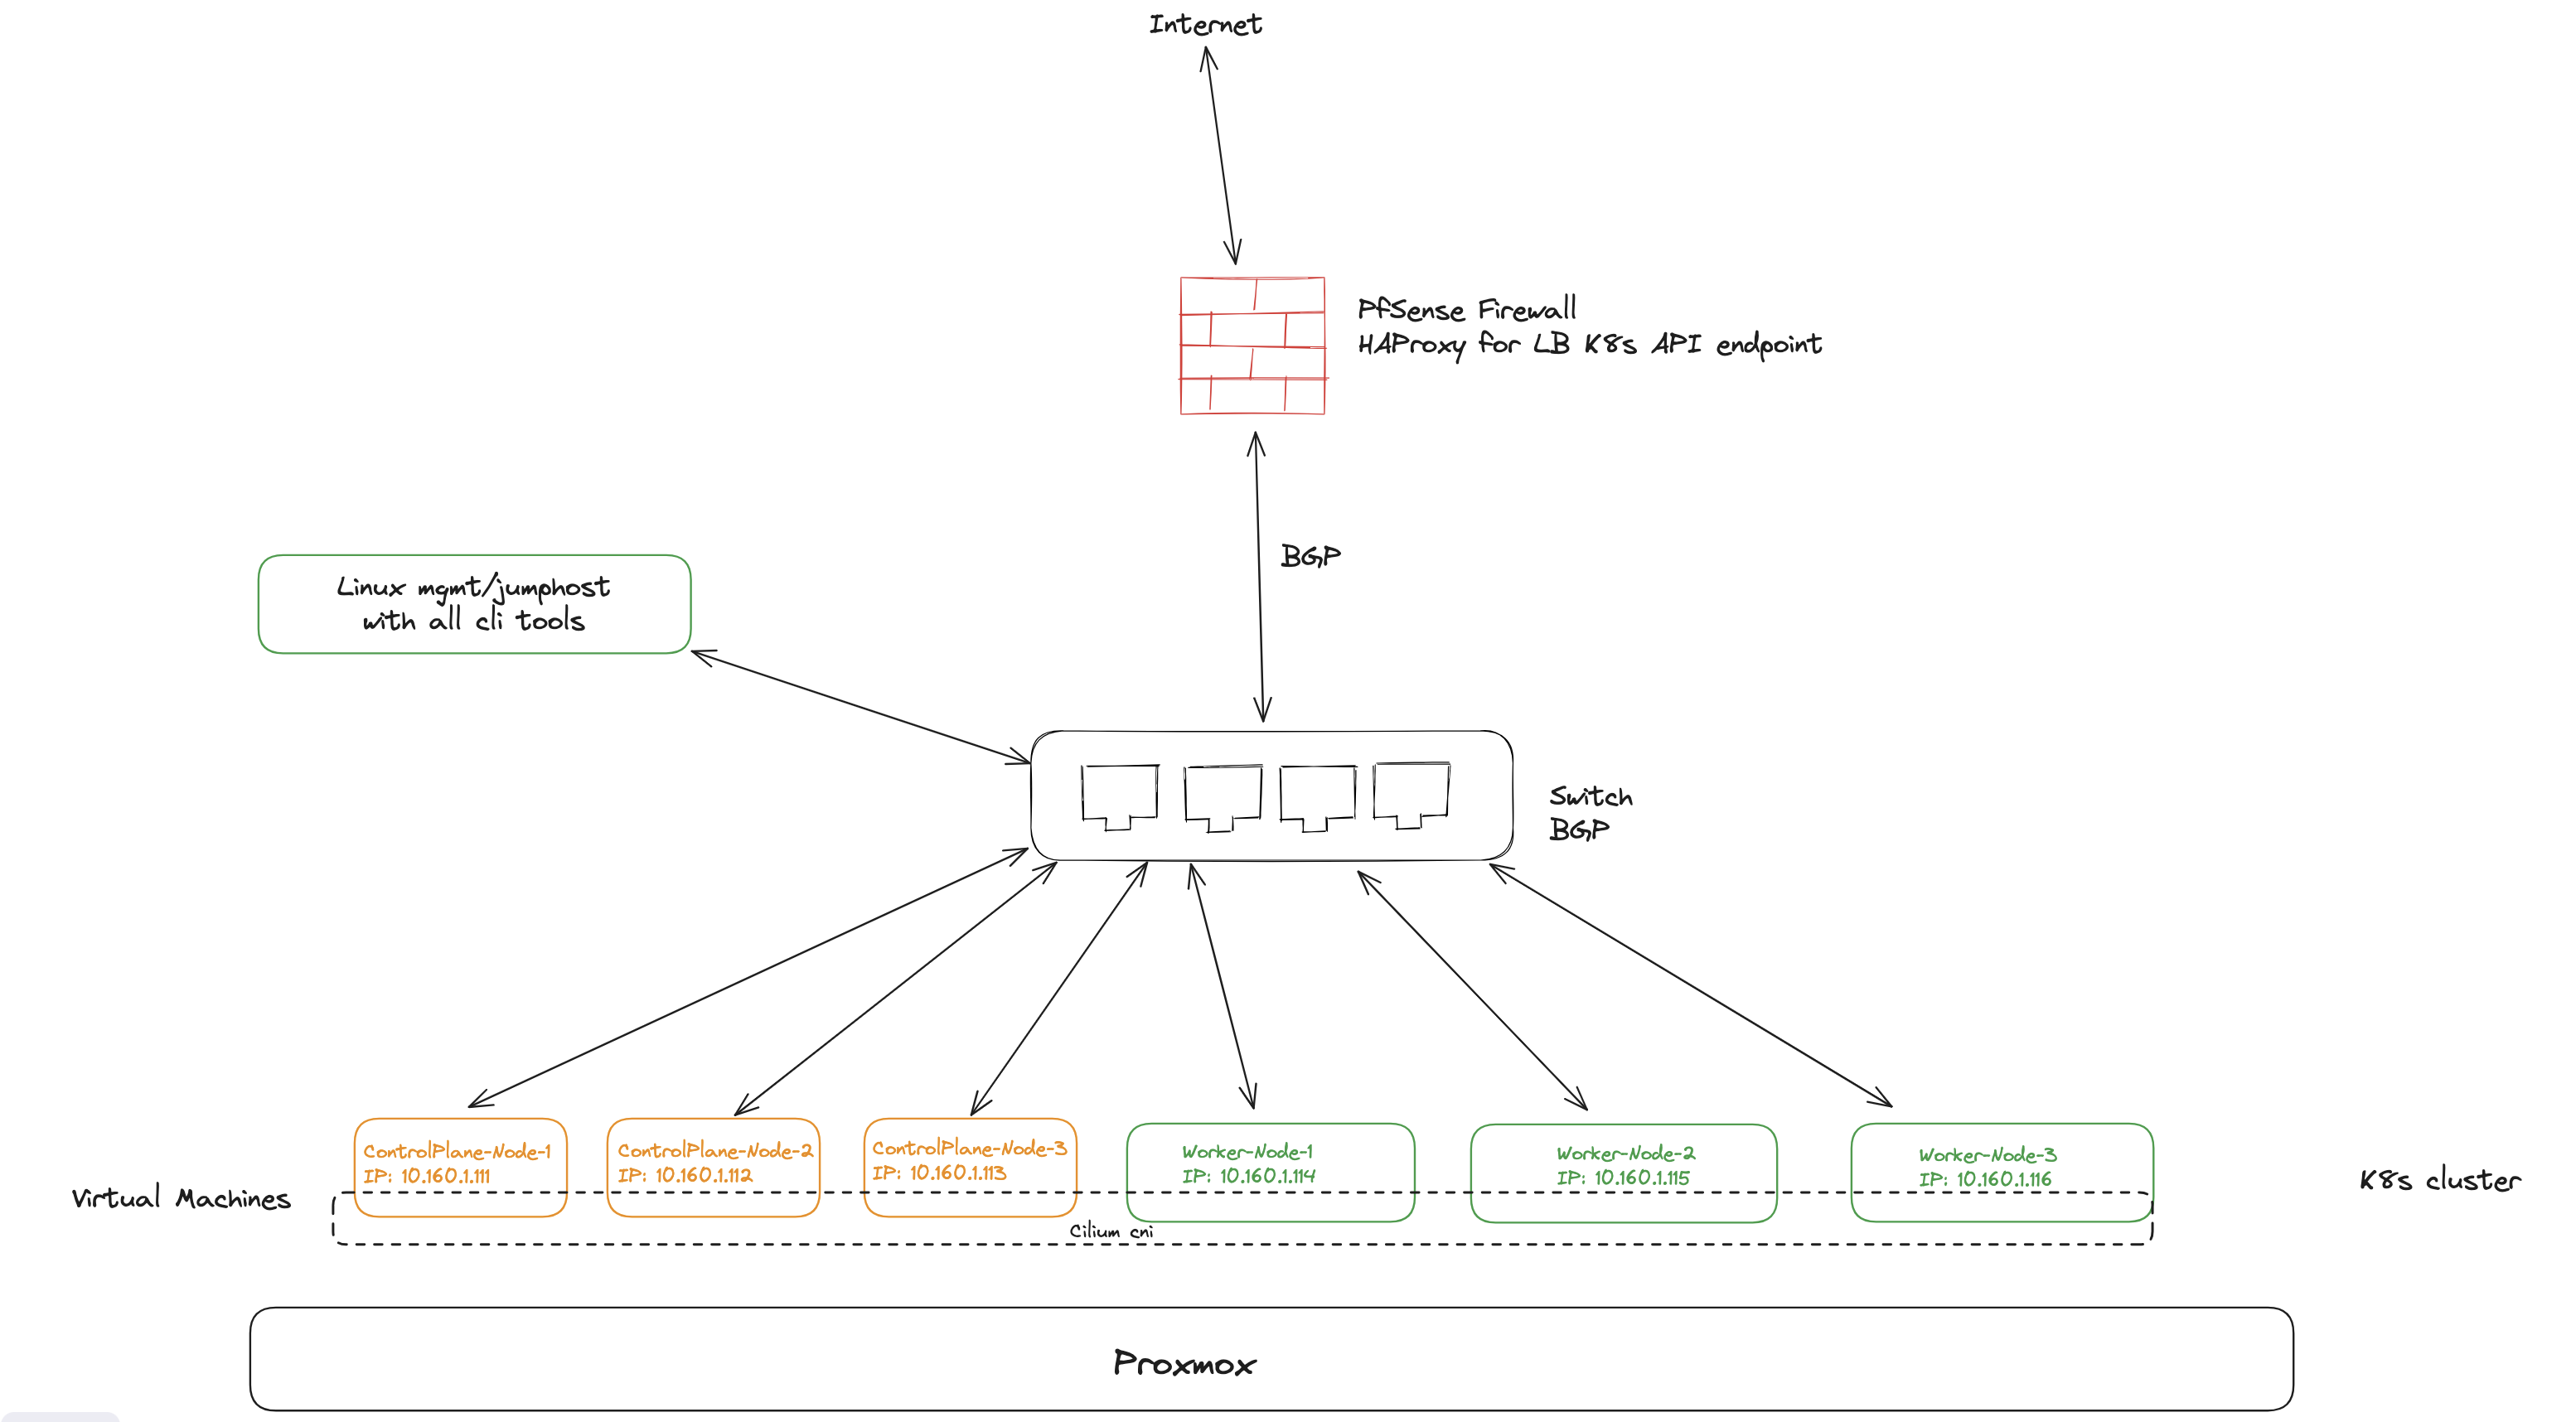
Before getting into the actual installaton and configuration of Traefik, a quick context.
My lab in this post:
A physical server running Proxmox
A physical switch with VLAN and routing support
Virtual PfSense firewall
Kubernetes version 1.28.2
3x Control Plane nodes (Ubuntu)
3x Worker nodes (Ubuntu)
A management Ubuntu VM (also running on Proxmox) with all tools needed like Helm and kubectl
Cert-Manager configured and installed with LetsEncrypt provider
Cilium has been configured with BGP, LB IPAM pools have been defined an provide external ip addresses to servicetype loadBalancer requests in the Kubernetes cluster
Now it would be as simple as just installing Traefik using helm install traefik traefik/traefik -n traefik, but I have done some adjustements in the values. So before I install Traefik I have adjusted the chart values for Traefik to use this config. See comments inline below. Note that I have removed all the comments from the default value.yaml and just added my own comments. The value yaml can be fetched by issuing this command: helm show values traefik/traefik > traefik-values.yaml
image:registry:docker.iorepository:traefiktag:""pullPolicy:IfNotPresentcommonLabels:{}deployment:enabled:truekind:Deploymentreplicas:3### Adjusted to three for high availabilityterminationGracePeriodSeconds:60minReadySeconds:0annotations:{}labels:{}podAnnotations:{}podLabels:{}additionalContainers:[]additionalVolumes:[]initContainers:# The "volume-permissions" init container is required if you run into permission issues.# Related issue: https://github.com/traefik/traefik-helm-chart/issues/396- name:volume-permissionsimage:busybox:latestcommand:["sh","-c","touch /data/acme.json; chmod -v 600 /data/acme.json"]securityContext:runAsNonRoot:truerunAsGroup:65532runAsUser:65532volumeMounts:- name:datamountPath:/datashareProcessNamespace:falsednsConfig:{}imagePullSecrets:[]lifecycle:{}podDisruptionBudget:enabled:falseingressClass:enabled:trueisDefaultClass:false# I have set this to false as I also have Cilium IngressControllerexperimental:plugins:{}kubernetesGateway:enabled:falseingressRoute:dashboard:enabled:false# I will enable this laterannotations:{}labels:{}matchRule:PathPrefix(`/dashboard`) || PathPrefix(`/api`)entryPoints:["traefik"]middlewares:[]tls:{}healthcheck:enabled:falseannotations:{}labels:{}matchRule:PathPrefix(`/ping`)entryPoints:["traefik"]middlewares:[]tls:{}updateStrategy:type:RollingUpdaterollingUpdate:maxUnavailable:0maxSurge:1readinessProbe:failureThreshold:1initialDelaySeconds:2periodSeconds:10successThreshold:1timeoutSeconds:2livenessProbe:failureThreshold:3initialDelaySeconds:2periodSeconds:10successThreshold:1timeoutSeconds:2startupProbe:providers:kubernetesCRD:enabled:true# set to trueallowCrossNamespace:true# set to trueallowExternalNameServices:true# set to true alsoallowEmptyServices:falsenamespaces:[]kubernetesIngress:enabled:true# set to trueallowExternalNameServices:true# set to trueallowEmptyServices:falsenamespaces:[]publishedService:enabled:falsefile:enabled:falsewatch:truecontent:""volumes:[]additionalVolumeMounts:[]logs:general:level:ERRORaccess:enabled:falsefilters:{}fields:general:defaultmode:keepnames:{}headers:defaultmode:dropnames:{}metrics:prometheus:entryPoint:metricsaddEntryPointsLabels:true# set to trueaddRoutersLabels:true# set to trueaddServicesLabels:true# set to truebuckets:"0.1,0.3,1.2,5.0,10.0"# adjusted according to the official docstracing:{}globalArguments:- "--global.checknewversion"- "--global.sendanonymoususage"additionalArguments:[]env:- name:POD_NAMEvalueFrom:fieldRef:fieldPath:metadata.name- name:POD_NAMESPACEvalueFrom:fieldRef:fieldPath:metadata.namespaceenvFrom:[]ports:# these are the entrypointstraefik:port:9000expose:falseexposedPort:9000protocol:TCPweb:port:8000expose:trueexposedPort:80protocol:TCPwebsecure:port:8443expose:trueexposedPort:443protocol:TCPhttp3:enabled:falsetls:enabled:trueoptions:""certResolver:""domains:[]middlewares:[]metrics:port:9100expose:trueexposedPort:9100protocol:TCPtlsOptions:{}tlsStore:{}service:enabled:false# I will create this later, set to false, all values below will be ignoredsingle:truetype:LoadBalancerannotations:{}annotationsTCP:{}annotationsUDP:{}labels:env:prodspec:loadBalancerIP:"10.150.11.11"loadBalancerSourceRanges:[]externalIPs:[]autoscaling:enabled:false#This is interesting, need to testpersistence:enabled:trueresourcePolicy:"keep"# I have added this to keep the PVC even after uninstallname:dataaccessMode:ReadWriteOncesize:128Mipath:/dataannotations:{}certResolvers:{}hostNetwork:falserbac:enabled:truenamespaced:falsepodSecurityPolicy:enabled:falseserviceAccount:name:""serviceAccountAnnotations:{}resources:{}nodeSelector:{}tolerations:[]topologySpreadConstraints:[]priorityClassName:""securityContext:capabilities:drop:[ALL]readOnlyRootFilesystem:trueallowPrivilegeEscalation:falsepodSecurityContext:fsGroupChangePolicy:"OnRootMismatch"runAsGroup:65532runAsNonRoot:truerunAsUser:65532extraObjects:[]
Now I can install Traefik using the following command:
helm install traefik traefik/traefik -f traefik-values.yaml -n traefik
# or
helm upgrade -i traefik traefik/traefik -f traefik-values.yaml -n traefik
When updating changes etc. or just use from the start.
After a successful installation we should see this message:
Release "traefik" has been upgraded. Happy Helming!
NAME: traefik
LAST DEPLOYED: Wed Dec 27 20:36:23 2023NAMESPACE: traefik
STATUS: deployed
REVISION: 15TEST SUITE: None
NOTES:
Traefik Proxy v2.10.6 has been deployed successfully on traefik namespace !
🚨 When enabling persistence for certificates, permissions on acme.json can be
lost when Traefik restarts. You can ensure correct permissions with an
initContainer. See https://github.com/traefik/traefik-helm-chart/issues/396 formore info. 🚨
Now I should also have a bunch of CRDs, an additional IngressClass (if you have a couple from before as I did).
andreasm@linuxmgmt01:~/prod-cluster-1/traefik$ k get crd
NAME                                         CREATED AT
ingressroutes.traefik.containo.us            2023-12-24T08:53:45Z
ingressroutes.traefik.io                     2023-12-24T08:53:45Z
ingressroutetcps.traefik.containo.us         2023-12-24T08:53:45Z
ingressroutetcps.traefik.io                  2023-12-24T08:53:45Z
ingressrouteudps.traefik.containo.us         2023-12-24T08:53:45Z
ingressrouteudps.traefik.io                  2023-12-24T08:53:45Z
middlewares.traefik.containo.us              2023-12-24T08:53:45Z
middlewares.traefik.io                       2023-12-24T08:53:45Z
middlewaretcps.traefik.containo.us           2023-12-24T08:53:45Z
middlewaretcps.traefik.io                    2023-12-24T08:53:46Z
serverstransports.traefik.containo.us        2023-12-24T08:53:45Z
serverstransports.traefik.io                 2023-12-24T08:53:46Z
serverstransporttcps.traefik.io              2023-12-24T08:53:46Z
tlsoptions.traefik.containo.us               2023-12-24T08:53:45Z
tlsoptions.traefik.io                        2023-12-24T08:53:46Z
tlsstores.traefik.containo.us                2023-12-24T08:53:45Z
tlsstores.traefik.io                         2023-12-24T08:53:46Z
traefikservices.traefik.containo.us          2023-12-24T08:53:45Z
traefikservices.traefik.io                   2023-12-24T08:53:46Z
A note on this list of CRDs above. The former Traefik APIs used the traefik.containo.us but from version Traefik 2.x they are now using the APIs traefik.io the former APIs are there for backward compatibility.
Below I can see the new Traefik Ingress controller.
andreasm@linuxmgmt01:~/prod-cluster-1/traefik$ k get ingressclasses.networking.k8s.io
NAME      CONTROLLER                      PARAMETERS   AGE
cilium    cilium.io/ingress-controller    <none>       10d
traefik   traefik.io/ingress-controller   <none>       59s
Deployment info:
andreasm@linuxmgmt01:~/prod-cluster-1/traefik$ k get all -n traefik
NAME READY STATUS RESTARTS AGE
pod/traefik-59657c9c59-75cxg 1/1 Running 0 27h
pod/traefik-59657c9c59-p2kdv 1/1 Running 0 27h
pod/traefik-59657c9c59-tqcrm 1/1 Running 0 27h
NAME TYPE CLUSTER-IP EXTERNAL-IP PORT(S) AGE
# No services...NAME READY UP-TO-DATE AVAILABLE AGE
deployment.apps/traefik 3/3 33 2d11h
NAME DESIRED CURRENT READY AGE
replicaset.apps/traefik-59657c9c59 333 27h
Now it is all about configuring Traefik to receieve the requests, configure routes, middleware and services. I will start by getting the Traefik dashboard up.
As I have disabled all the services in the Helm value yaml none are created, therefore I need to create these entrypoints before anything can reach Traefik.
A quick explanation why wanted to create these myself. One can have multiple entrypoints to Traefik, even in the same Kubernetes cluster. Assume I want to use different IP addresses and subnets for certain services, some may even call it VIPs, for IP separation, easier physical firewall creation etc. Then I need to create these services to expose the entrypoints I want to use. The Helm chart enables 4 entrypoints by default: web port 8000 (http), websecure port 8443 (https), traefik port 9000 and metrics port 9100 TCP. But these are only configured on the Traefik pods themselves, there is no service to expose them either internally in the cluster or outside. So I need to create these external or internal services to expose these entrypoints.
My first service I define and apply will primarily be used for management, interacting with Traefik internal services using the correct label selector to select the Traefik pods and refering to the two entrypoint web and websecure. This is how the first entrypoint is defined:
This will create a servicetype LoadBalancer, the IP address is fixed by using the annotation and my confiigured Cilium LB-IPAM pool will provide the IP address for the service and BGP control plane will take care of advertising the IP address for me.
Lets apply the above yaml and check the service:
andreasm@linuxmgmt01:~/prod-cluster-1/traefik$ k get svc -n traefik
NAME                     TYPE           CLUSTER-IP     EXTERNAL-IP    PORT(S)                      AGE
traefik-mgmt             LoadBalancer   10.21.183.19   10.150.11.11   80:30343/TCP,443:30564/TCP   49s
This means I can now start registering relevant DNS records to this external IP and Traefik will receieve requests coming to this address/service.
But as I would like to separate out services by type/function using different ip addresses I have created another service using the same entrypoints but with a different external-ip.
I can go ahead and register DNS records against this IP address also and they will be forwarded to Traefik to handle.
The beauty of this is that I can create as many services I want, using different external-ip addresses, and even specify different Traefik entrypoints. In my physical firewall I can more easily create firewall rules allowing or denying which source is allowed to reach these ip-addresses and then separate out apps from apps, services from services. Like in the next chapter when I expose the Traefik Dashboard.
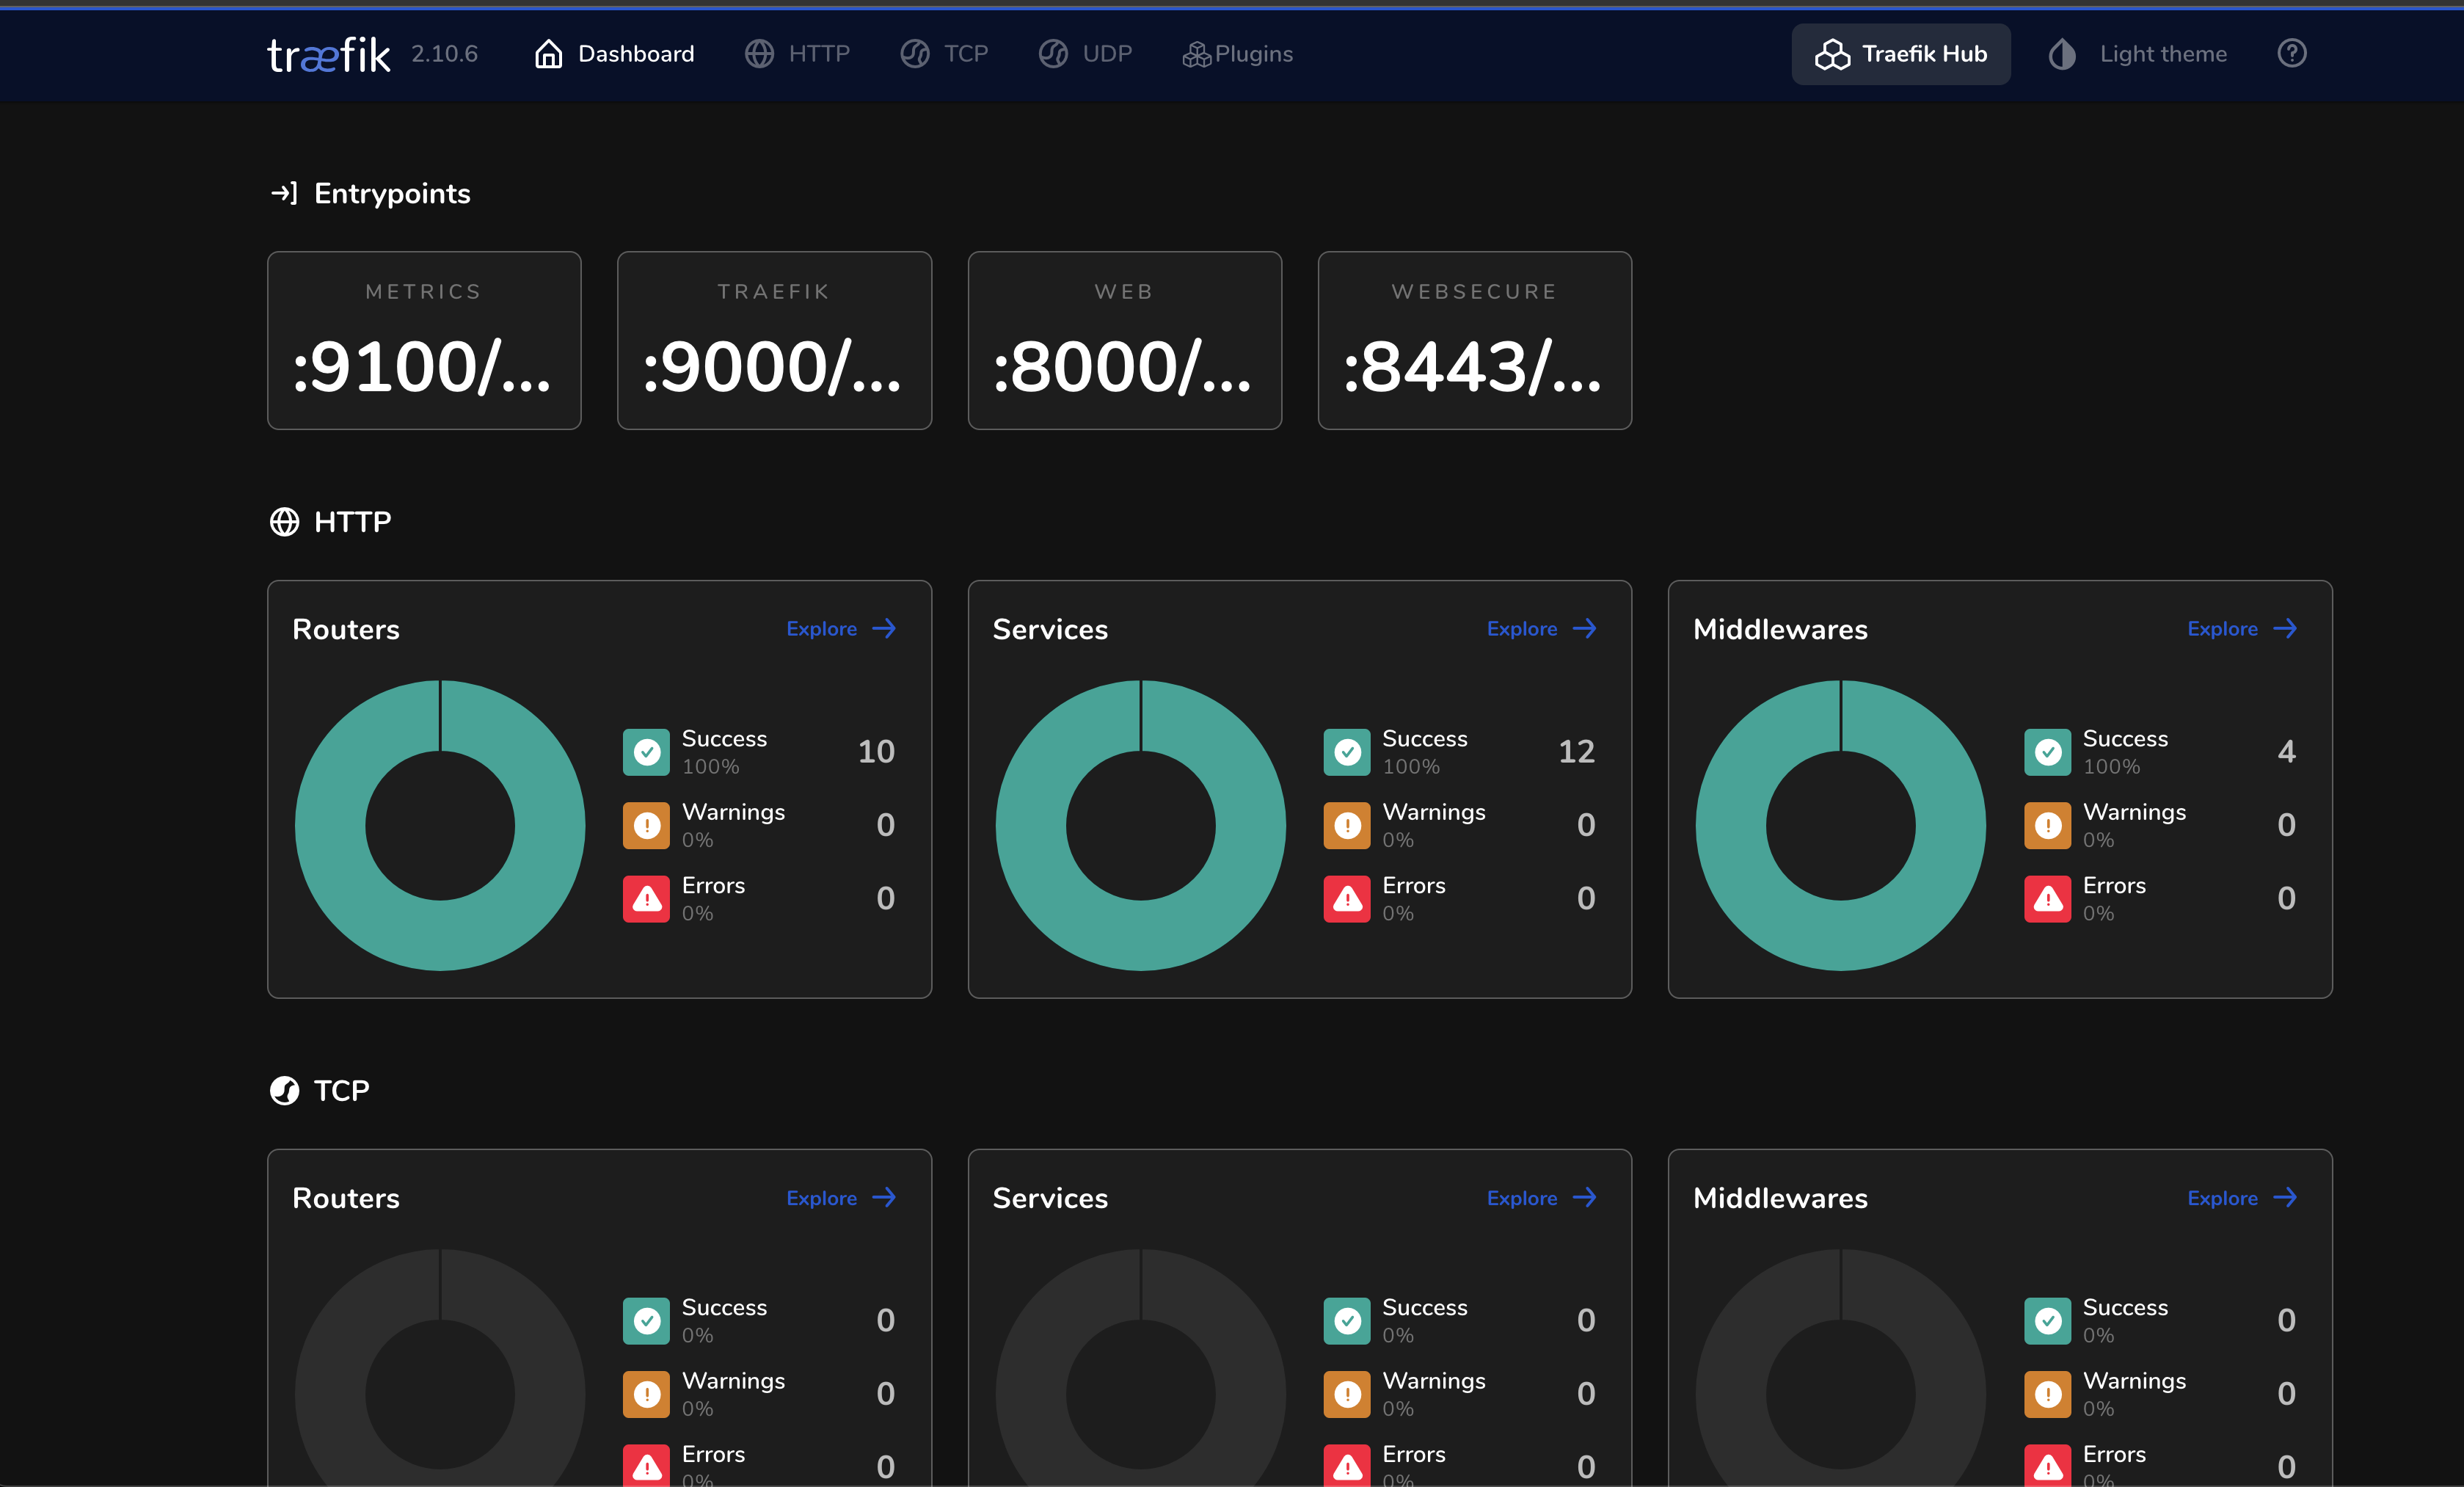
Traffic comes with a nice dashboard which gives a quick overview of services enabled, status and detailed information:
As I have not enabled any services I will need to define these to make the Dashboard accessible. I also want it accessible from outside my Kubernetes cluster using basic authentication.
I will prepare three yaml files. The first one will be the secret for the authentication part, the second the middleware config to enable basic authentication and the third and final the actual IngressRoute.
For the secret I used the following command to generate a base64 encoded string containing both username and password:
Notice I refer to a tls secret? More on this just a tad later.
Lets see the three objects created.
andreasm@linuxmgmt01:~/prod-cluster-1/traefik/traefik-dashboard$ k get secrets -n traefik
NAME                             TYPE                 DATA   AGE
traefik-dashboard-auth           Opaque               1      39s
andreasm@linuxmgmt01:~/prod-cluster-1/traefik/traefik-dashboard$ k get middleware.traefik.io -n traefik
NAME                          AGE
traefik-dashboard-basicauth   55s
andreasm@linuxmgmt01:~/prod-cluster-1/traefik/traefik-dashboard$ k get ingressroutes.traefik.io -n traefik
NAME                         AGE
traefik-dashboard            1m
I have created a DNS record to point to external-ip of the traefik-mgmt service and made sure the Host definition in the IngressRoute matches this dns.
Now the dashboard is available and prompting for username and password.
Instead of configuring Traefik to generate the certificates I need for my HTTPS services I have already configured Cert-Manager to create the certificates I need, you can read how I have done it here. I use mostly wildcard certificates, and dont see the need to request certificates all the time.
Then I use reflector to share/sync the certificates across namespaces. Read more on reflector here and here.
Another nice feature is Traefik’s built in Prometheus metrics. These Prometheus metrics can then be used as datasource in Grafana. So here is how I configured Prometheus and Grafana.
I followed these two blog post’s here and here, used them in combination to configure Traefik with Prometheus.
I will start by getting Prometheus up and running, then Grafana
In my Traefik value.yaml I made these changes before I ran helm upgrade on the Traefik installation:
metrics:## -- Prometheus is enabled by default.## -- It can be disabled by setting "prometheus: null"prometheus:# -- Entry point used to expose metrics.entryPoint:metrics## Enable metrics on entry points. Default=trueaddEntryPointsLabels:true## Enable metrics on routers. Default=falseaddRoutersLabels:true## Enable metrics on services. Default=trueaddServicesLabels:true## Buckets for latency metrics. Default="0.1,0.3,1.2,5.0"buckets:"0.1,0.3,1.2,5.0,10.0"
First I registered a DNS record on the external-ip service below with the name prometheus-traefik.my-domain.net as I consider this also a service that belongs within the management category. Now I have two dns records pointing to the same IP (the traefik-ui above included).
NAME TYPE CLUSTER-IP EXTERNAL-IP PORT(S)traefik-mgmt LoadBalancer 10.21.183.19 10.150.11.11 80:30343/TCP,443:30564/TCP
I will prepare 6 different yaml files. All files will be explained below.
First yaml traefik-metrics-service:
As I followed the two blogs above there is a couple of approaches to make this work. One approach is to to expose the metrics using ClusterIP by applying the yaml above. Then the Prometheus target is refering to this svc (requires Prometheus to be runnning on same cluster). The other approach is to configure Prometheus scraping the Traefik pods.
One can also use this ClusterIP service later on with an IngressRoute to expose it outside its Kubernetes cluster for an easy way to just check whether there is metrics coming or need to access this metrics externally. If scraping the pods, this service is not needed as Prometheus will scrape the Traefik pods directly.
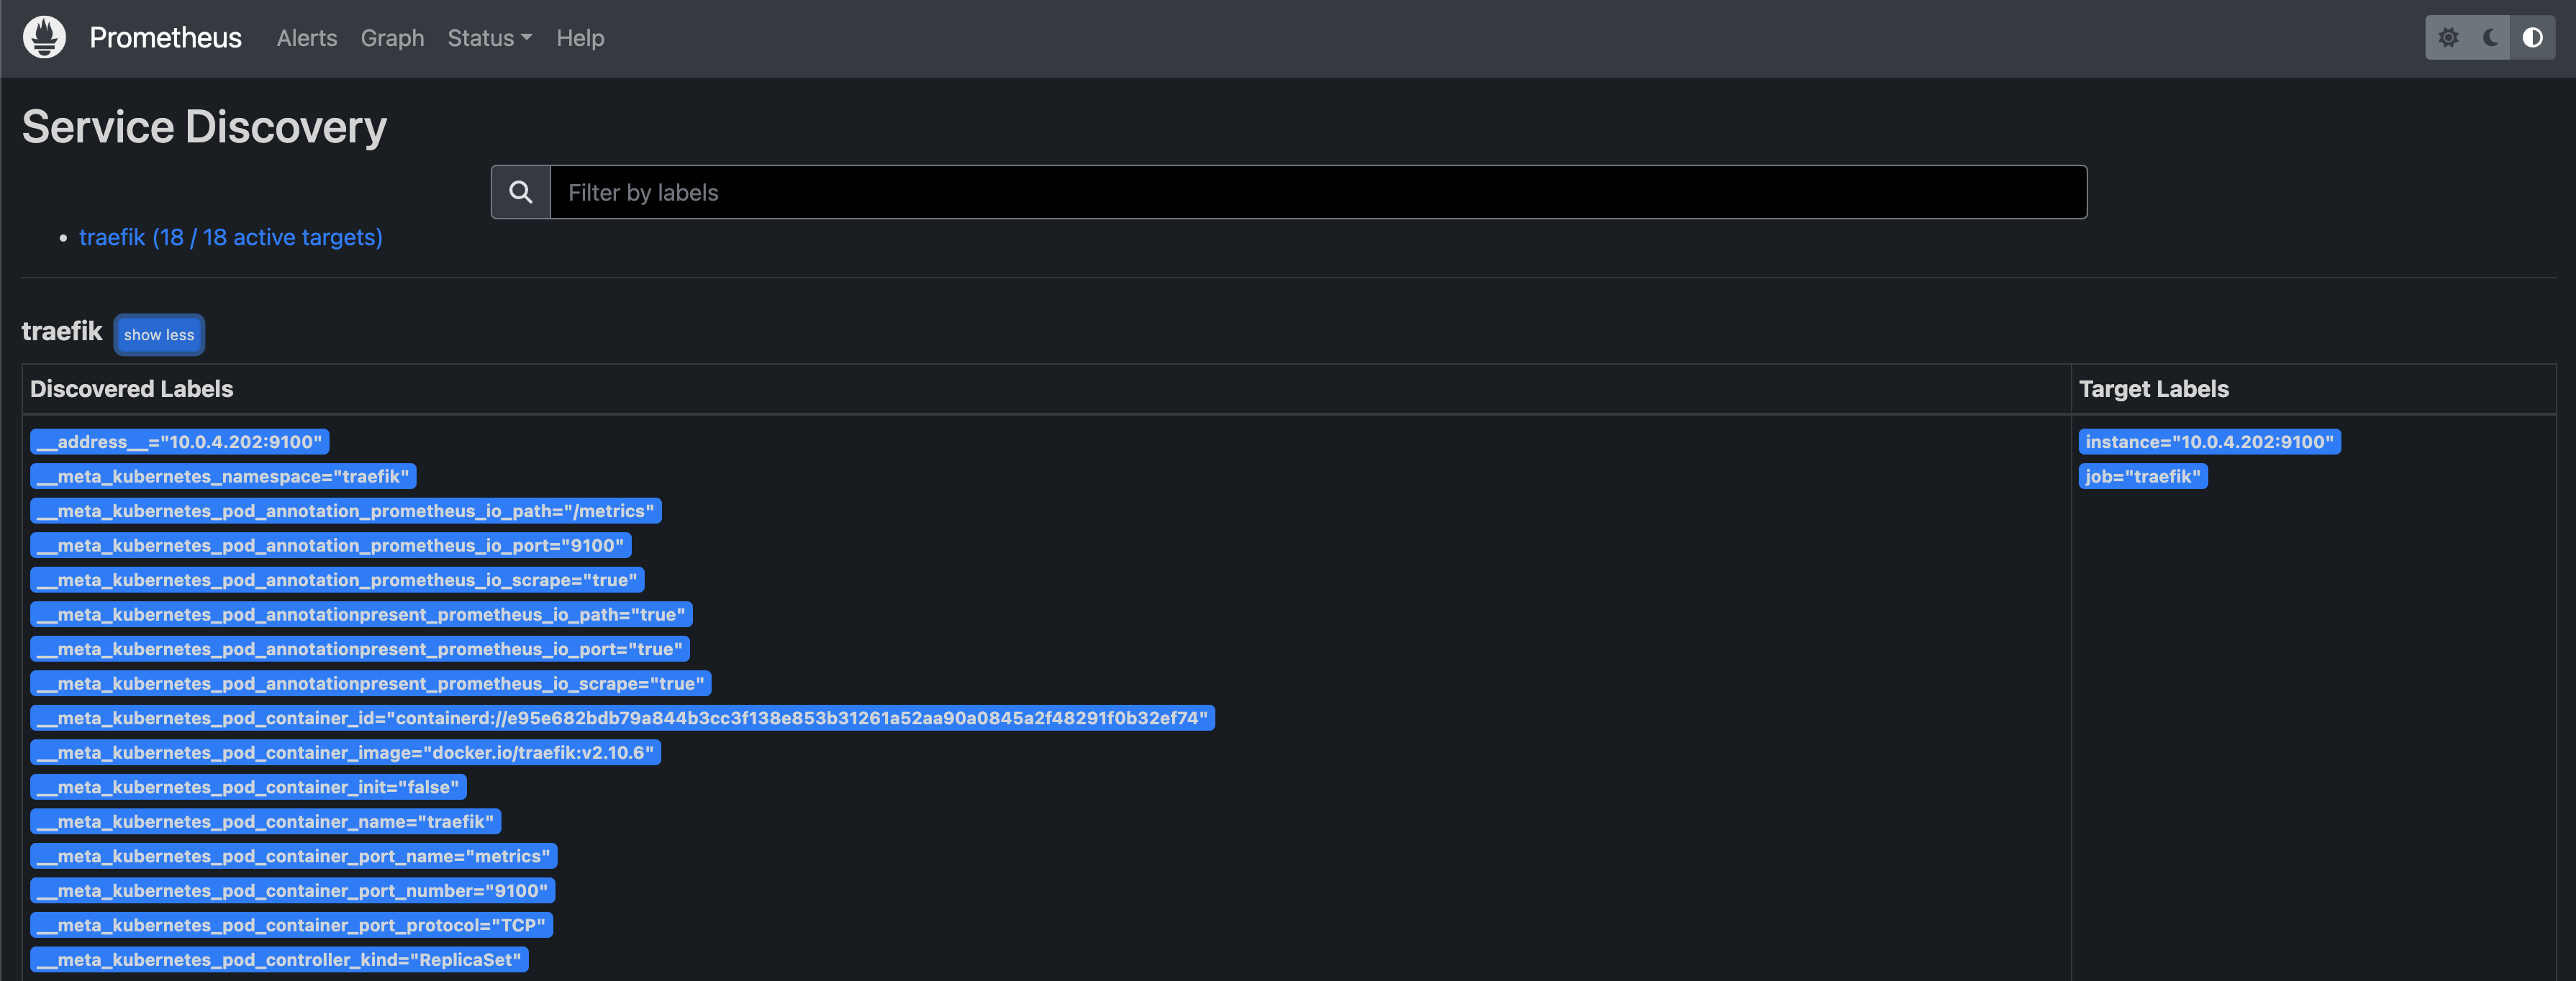
Then I need to create a Prometheus configMap telling Promethus what and how to scrape. I will paste below two ways Prometheus can scrape the metrics. The first yaml will scrape the pods directly using the kubernetes_sd_config and filter on the annotations on the Traefik pods.
This approach will scrape the metrics from the relevant Traefik pods, using annotation. But it also means I need to give the Prometheus pod access to scrape pods not in its own namespace. So I will go ahead and create a service account, role and role binding for that:
andreasm@linuxmgmt01:~/prod-cluster-1/traefik/traefik-dashboard$ kubectl -n prometheus create serviceaccount prometheus
serviceaccount/prometheus created
andreasm@linuxmgmt01:~/prod-cluster-1/traefik/traefik-dashboard$ k create clusterrole prometheus --verb=get,list,watch --resource=pods,services,endpoints
clusterrole.rbac.authorization.k8s.io/prometheus created
andreasm@linuxmgmt01:~/prod-cluster-1/traefik/traefik-dashboard$ kubectl create clusterrolebinding prometheus --clusterrole=prometheus --serviceaccount=prometheus:prometheus
clusterrolebinding.rbac.authorization.k8s.io/prometheus created
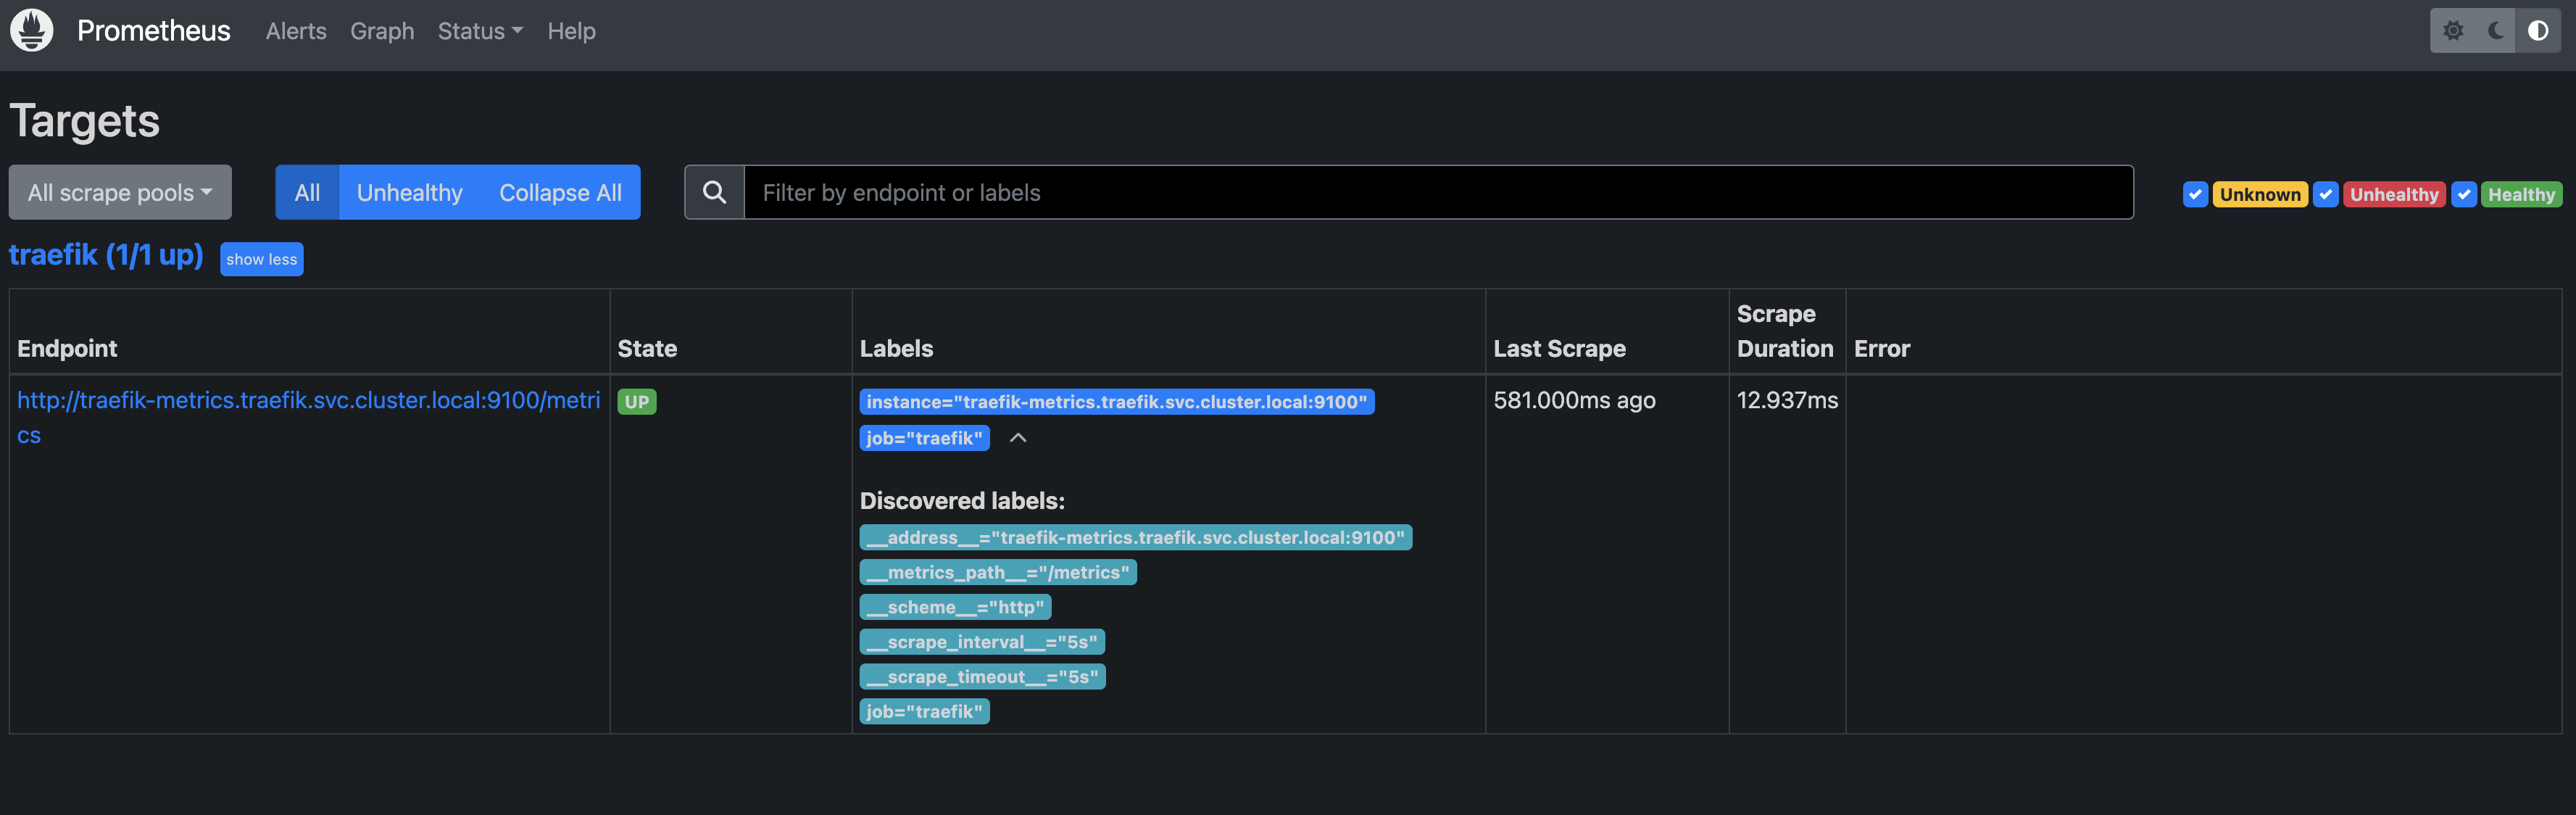
The second approach is to point to the ClusterIP metrics service (defined above) and let Prometheus scrape this service instead. This approach does not need the serviceAccount.
The fourth file is the actual Promethus deployment, refering to the objects created in the previous yamls:
apiVersion:apps/v1kind:Deploymentmetadata:name:prometheusnamespace:prometheusspec:selector:matchLabels:app:prometheusreplicas:1template:metadata:labels:app:prometheusspec:serviceAccountName:prometheus# Remember to add the serviceaccount for scrape accesscontainers:- name:prometheusimage:prom/prometheus:latestports:- containerPort:9090name:defaultvolumeMounts:- name:prometheus-storagemountPath:/prometheus- name:config-volumemountPath:/etc/prometheusvolumes:- name:prometheus-storagepersistentVolumeClaim:claimName:prometheus-storage-persistence- name:config-volumeconfigMap:name:prometheus-config
The fifth yaml file is the Prometheus service where I expose Prometheus internally in the cluster:
The last yaml is the IngressRoute if I want to access Promethus outside my Kubernetes Cluster. Strictly optional if Grafana is also deployed in the same cluster as it can then just use the previously created ClusterIP service. But nice to have if in need to troubleshoot etc.
Here comes the DNS record into play, the record I created earlier. Now after I have applied all the above yamls Prometheus should be up and running and I can use the IngressRoute to access the Prometheus Dashboard from my laptop.
Screnshot below is when scraping the pods directly
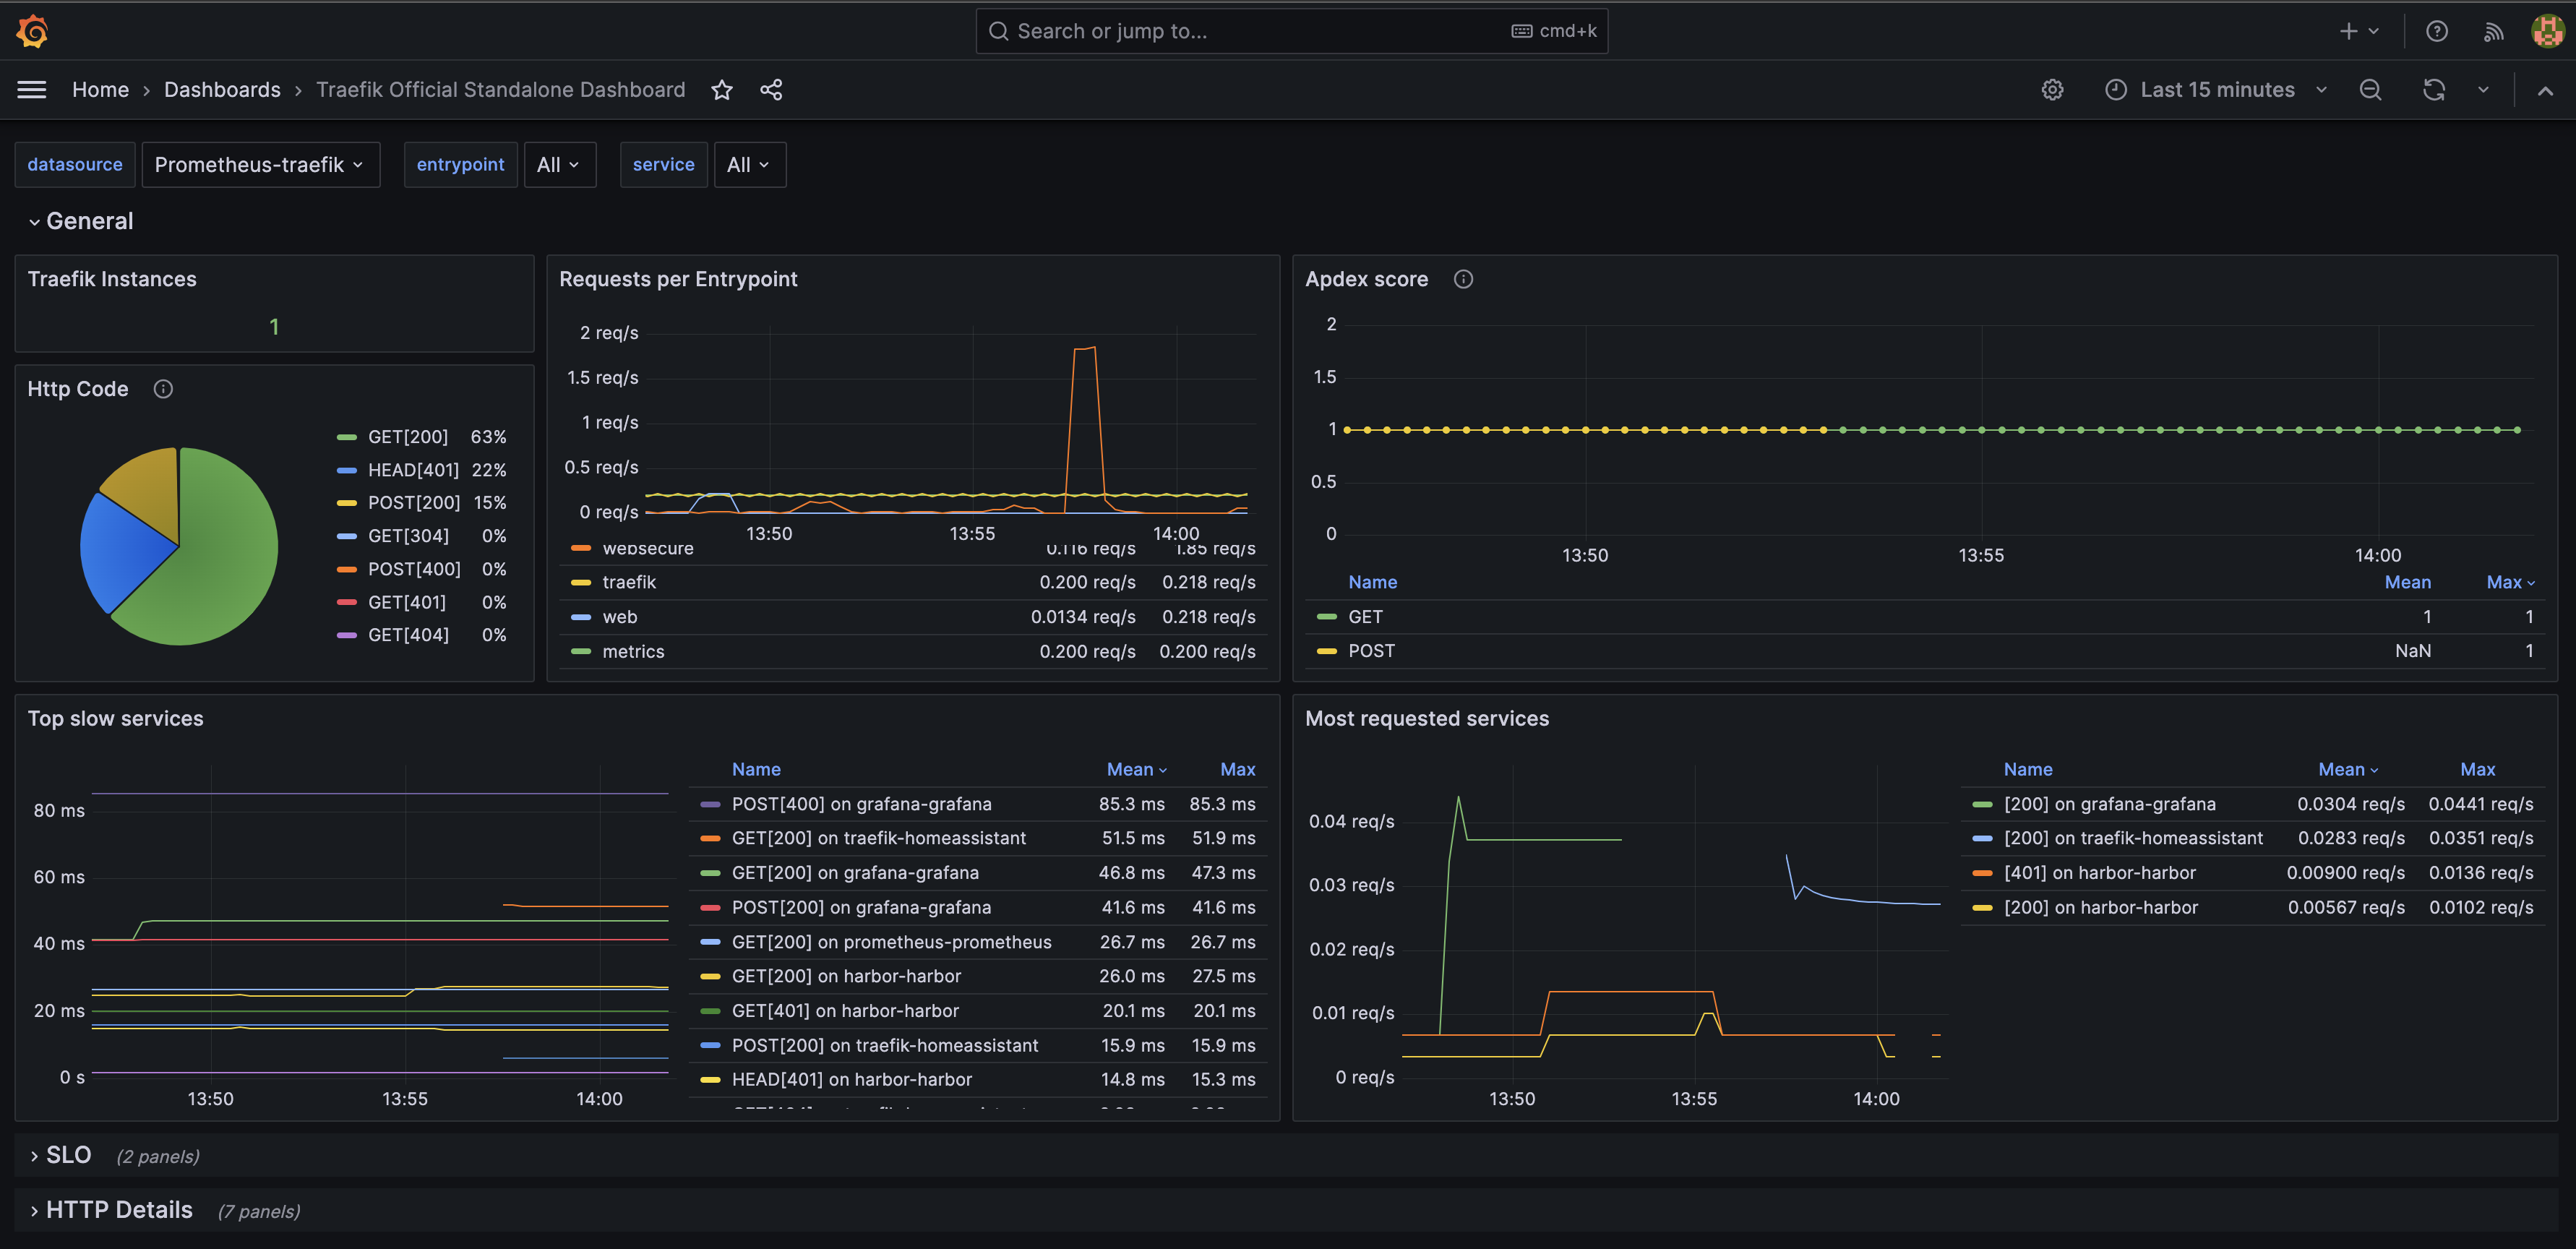
Now I more or less just need to install Grafana, add the Prometheus ClusterIP as datasource. To install Grafana, that is easily done by using Helm. Below is the steps I did to install Grafana:
helm repo add grafana https://grafana.github.io/helm-charts
helm repo update
## grabbing the default valueshelm show values grafana/grafana > grafana-values.yaml
Below is the changes I have done in the value.yaml I am using to install Grafana:
## Configure grafana datasources## ref: http://docs.grafana.org/administration/provisioning/#datasources##datasources:datasources.yaml:apiVersion:1datasources:- name:Prometheus-traefiktype:prometheusurl:http://prometheus.prometheus.svc.cluster.local:9090access:proxyeditable:trueorgId:1version:1isDefault:trueingress:enabled:falsepersistence:# type: pvcenabled:true# resourcePolicy: "keep"# storageClassName: defaultaccessModes:- ReadWriteOncesize:10Giannotations:helm.sh/resource-policy:"keep"finalizers:- kubernetes.io/pvc-protection# selectorLabels: {}## Sub-directory of the PV to mount. Can be templated.# subPath: ""## Name of an existing PVC. Can be templated.# existingClaim:## Extra labels to apply to a PVC.extraPvcLabels:{}## Expose the grafana service to be accessed from outside the cluster (LoadBalancer service).## or access it from within the cluster (ClusterIP service). Set the service type and the port to serve it.## ref: http://kubernetes.io/docs/user-guide/services/##service:enabled:truetype:ClusterIPport:80targetPort:3000# targetPort: 4181 To be used with a proxy extraContainer## Service annotations. Can be templated.annotations:{}labels:{}portName:service# Adds the appProtocol field to the service. This allows to work with istio protocol selection. Ex: "http" or "tcp"appProtocol:""# Administrator credentials when not using an existing secret (see below)adminUser:adminadminPassword:'password'
This will deploy Grafana with a pvc, not deleted if the Helm installation of Grafana is uninstalled, it will create a ClusterIP exposing the Grafana UI internally in the cluster. So I need to create an IngressRoute to expose it outside the cluster using Traefik.
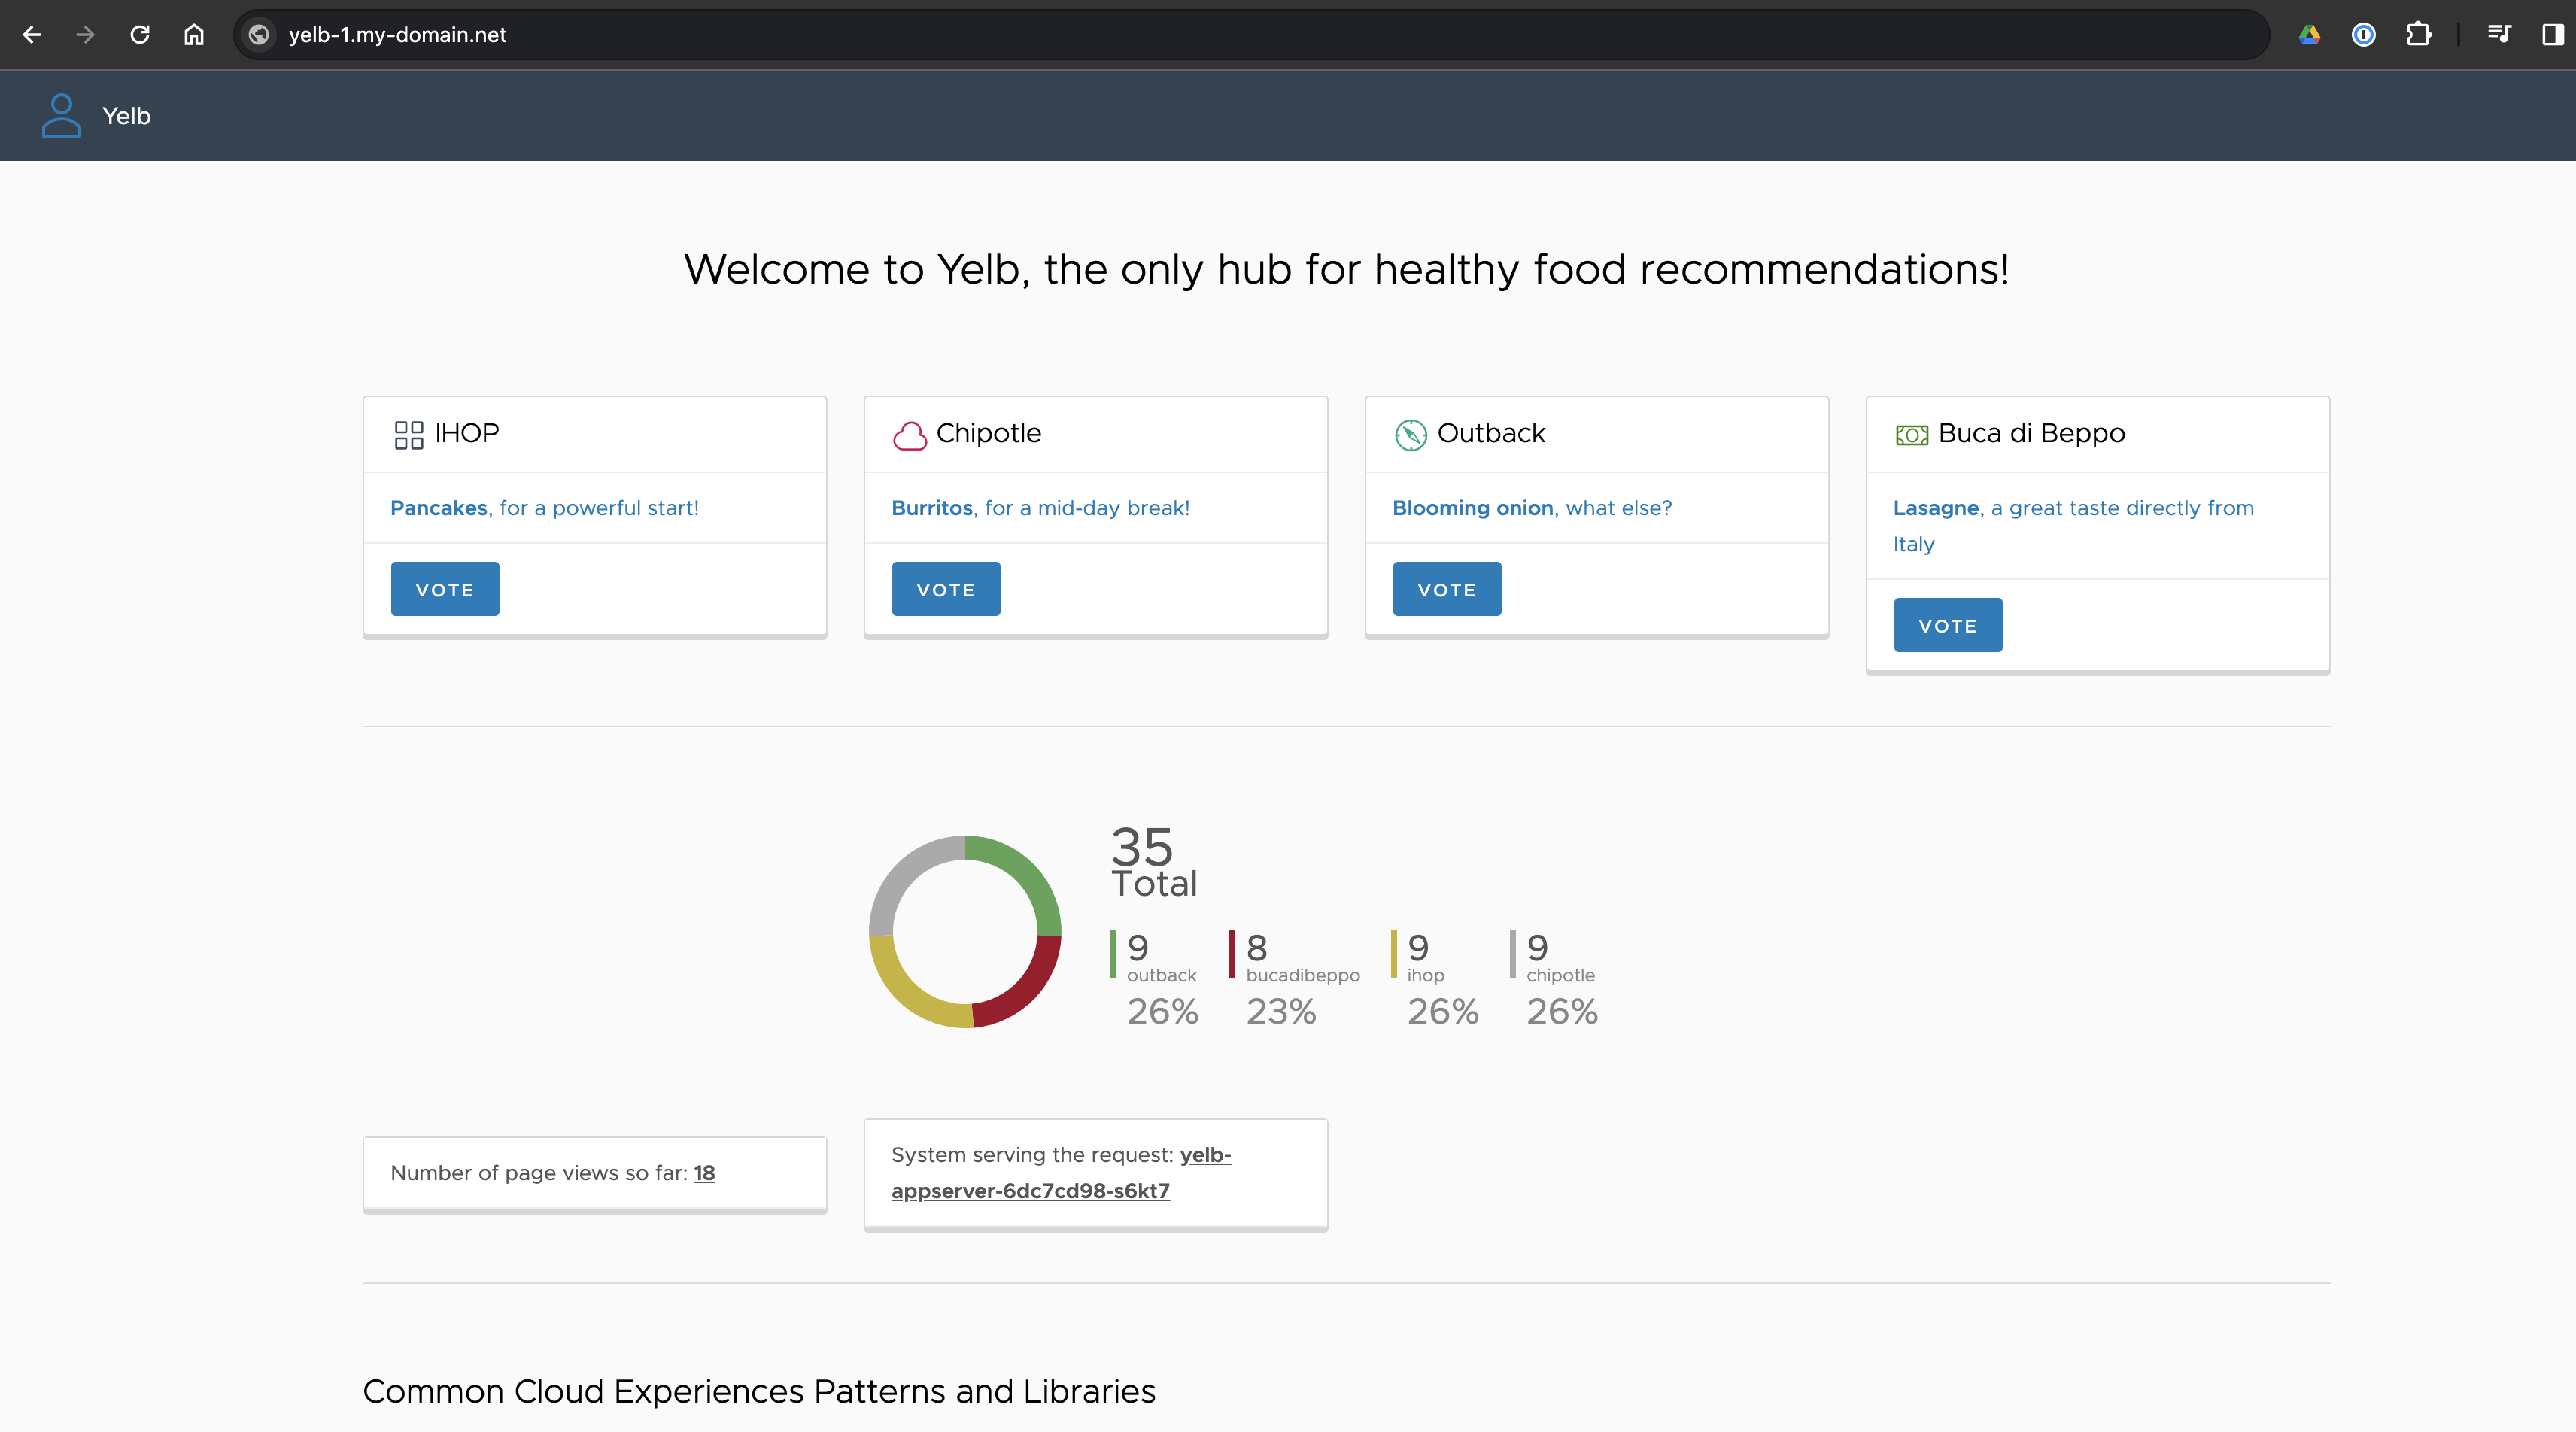
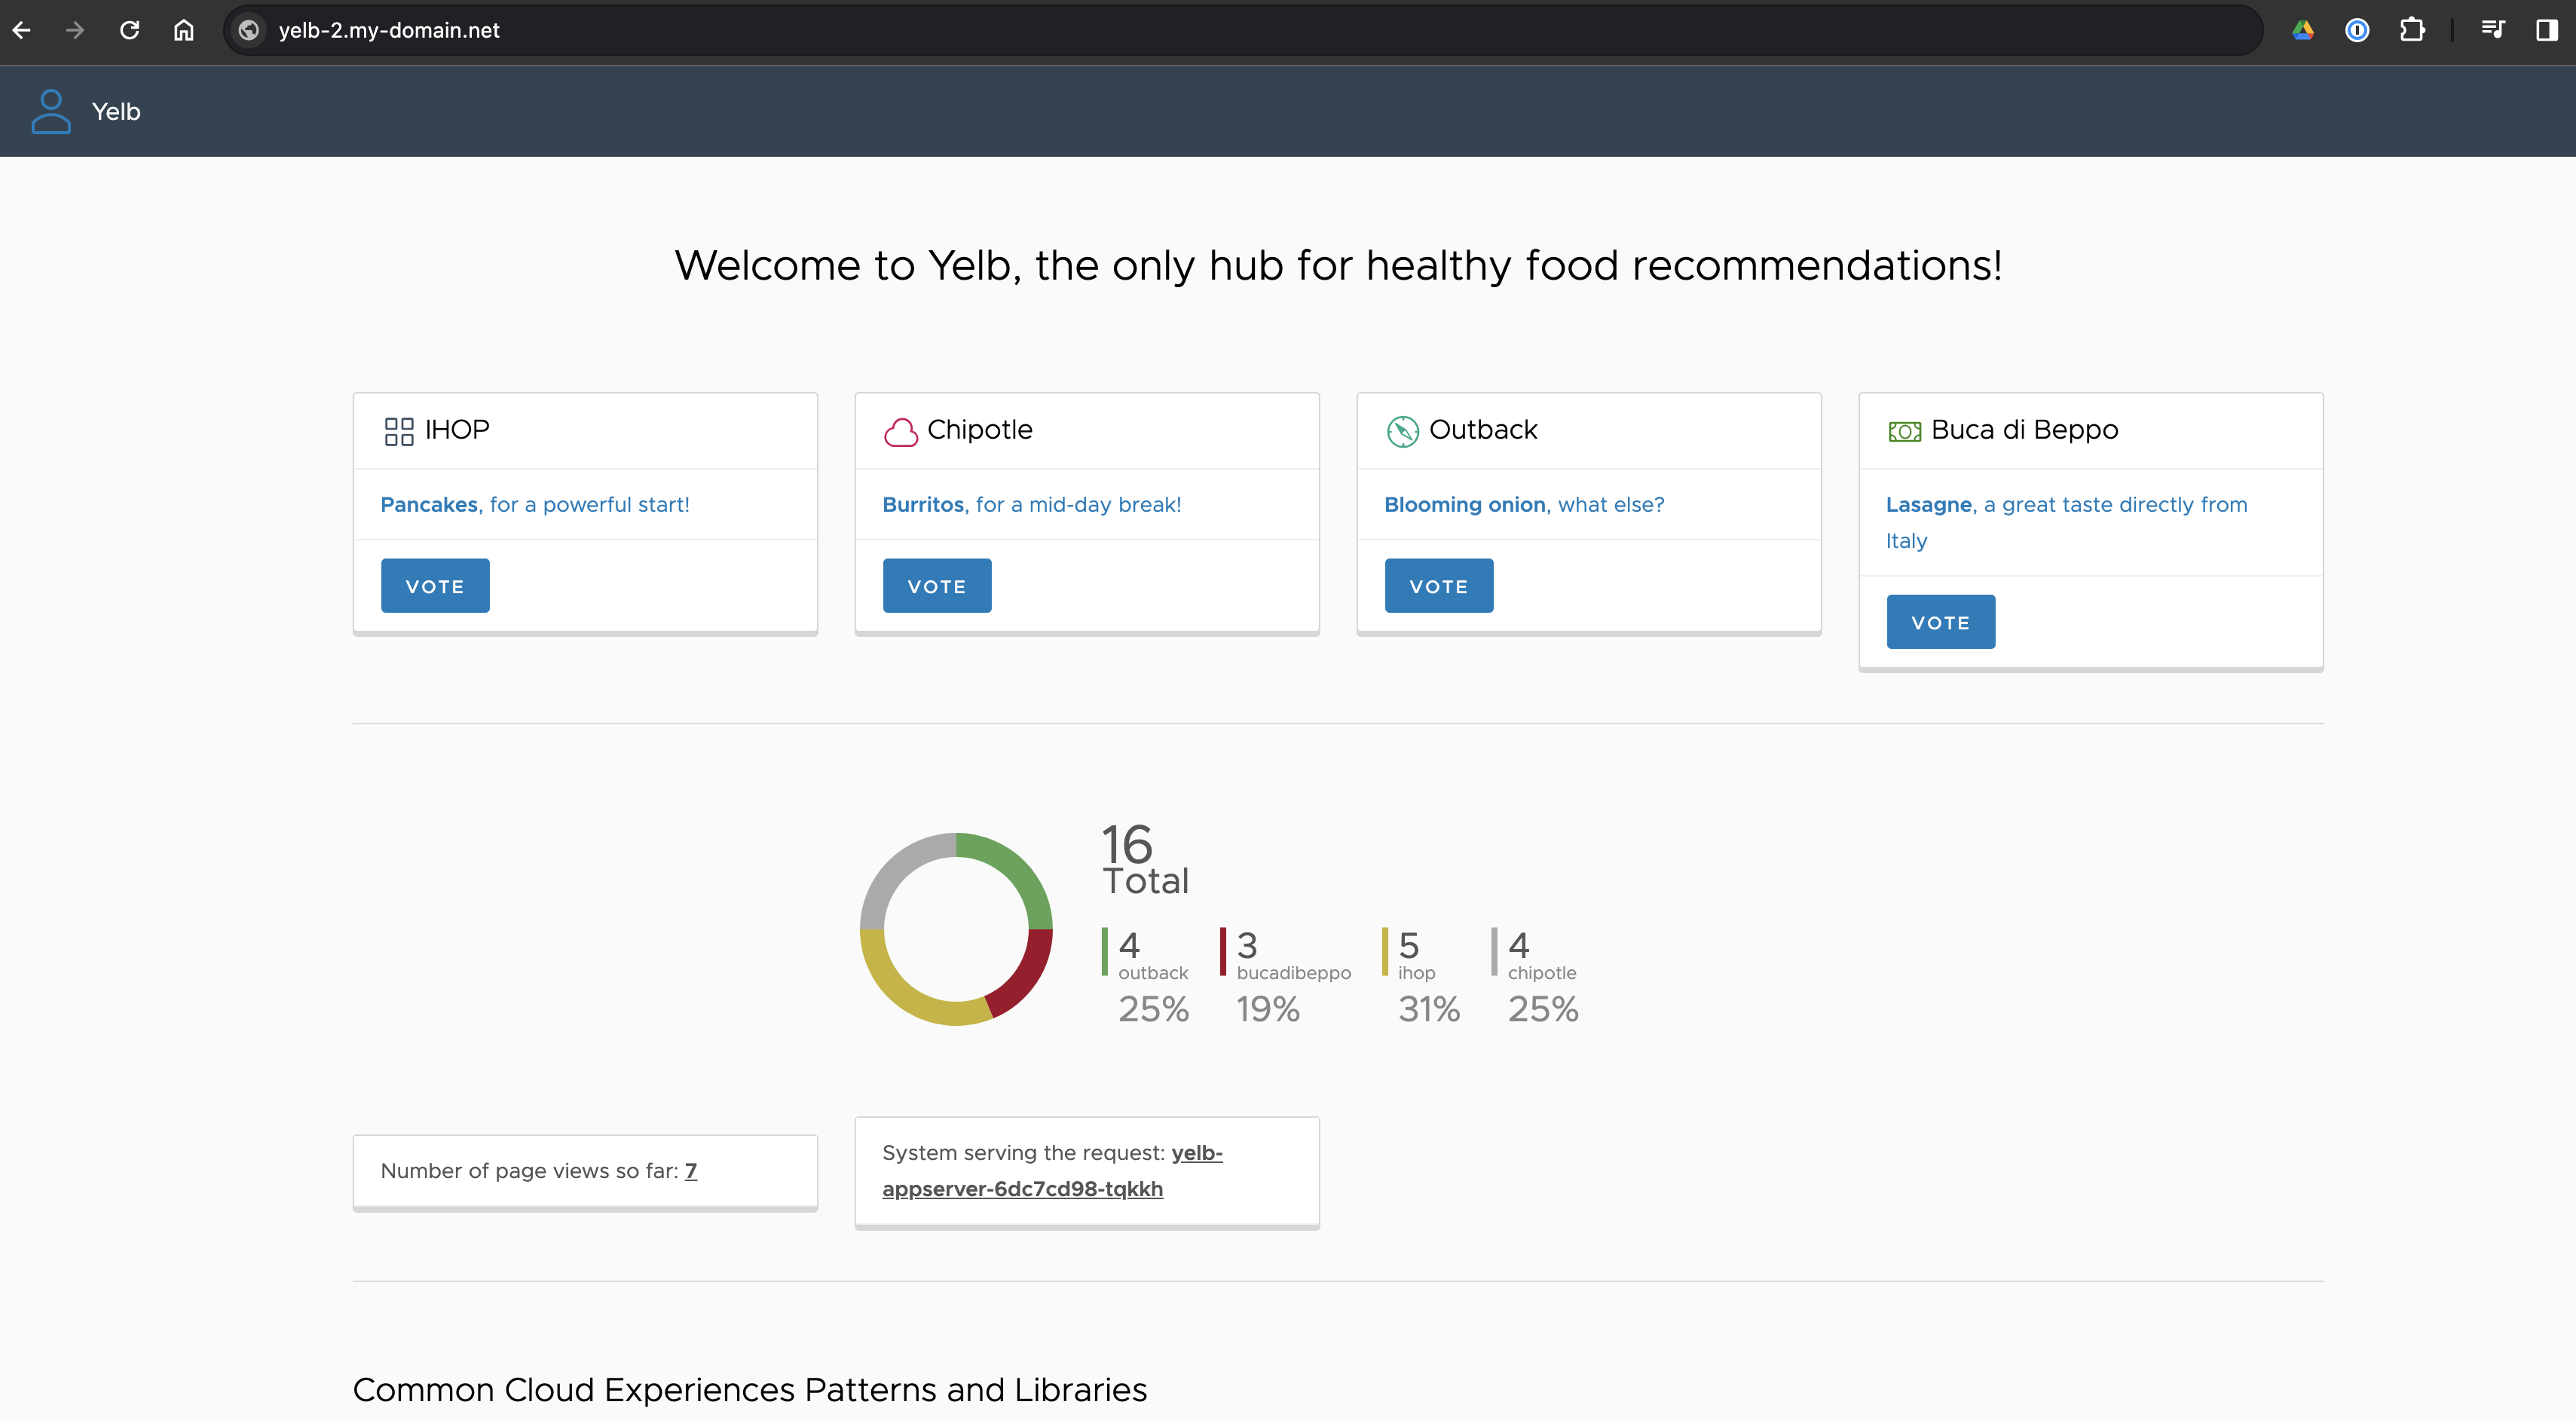
I wanted to just expose my test application Yelb deployed twice, but using two different DNS records. I also wanted these services to be exposed using a completely different subnet, to create the IP separation I have mentioned a couple of times.
I have already deployed the Yelb application twice in my cluster in their own respective namespaces:
andreasm@linuxmgmt01:~/prod-cluster-1/traefik/grafana$ k get pods -n yelb
NAME                            READY   STATUS    RESTARTS   AGE
redis-server-84f4bf49b5-fq26l   1/1     Running   0          13d
yelb-appserver-6dc7cd98-s6kt7   1/1     Running   0          13d
yelb-db-84d6f6fc6c-m7xvd        1/1     Running   0          13d
yelb-ui-6fbbcc4c87-qjdzg        1/1     Running   0          2d20h
andreasm@linuxmgmt01:~/prod-cluster-1/traefik/grafana$ k get pods -n yelb-2
NAME                            READY   STATUS    RESTARTS   AGE
redis-server-84f4bf49b5-4sx7f   1/1     Running   0          2d16h
yelb-appserver-6dc7cd98-tqkkh   1/1     Running   0          2d16h
yelb-db-84d6f6fc6c-t4td2        1/1     Running   0          2d16h
yelb-ui-2-84cc897d6d-64r9x      1/1     Running   0          2d16h
I want to expose the yelb-ui in both namespaces on their different DNS records using IngressRoutes. I also want to use a completely different external IP address than what I have been using so far under the management category. So this time I will be using this external-ip:
So I will need to register two DNS records against the IP above: 10.150.16.10 with the following names:
yellb-1.my-domain-net" and yelb-2.my-domain.net
Then I can expose the Yelb UI services from both the namespaces yelb and yelb-2 with the following IngressRoutes:
andreasm@linuxmgmt01:~/prod-cluster-1/cilium/test-apps/yelb$ k get ingressroutes.traefik.io -n yelb
NAME                  AGE
yelb-ingressroute-1   2d20h
andreasm@linuxmgmt01:~/prod-cluster-1/cilium/test-apps/yelb$ k get ingressroutes.traefik.io -n yelb-2
NAME                  AGE
yelb-ingressroute-2   2d16h
Now I can access both of them using their own dns records:
As Home Assistant is running outside my Kubernetes cluster I needed to create an ExternalName service in my Kubernetes cluster for Traefik to use when forwarding requests to my “external” Home Assistant server.
The IP is the IP of my Home Assistant server and the port it is listening on. I decided to place the service in the same namespace as Traefik as Home Assistant is not residing in any namespaces in my Kubernetes cluster.
For this to work I needed to make sure my Traefik installation had this value enabled in my value.yaml config before running the helm upgrade of the Traefik installation:
providers:kubernetesCRD:# -- Allows to reference ExternalName services in IngressRouteallowExternalNameServices:true
Here is the service after it has been applied:
andreasm@linuxmgmt01:~/prod-cluster-1/traefik/hass$ k get svc -n traefik
NAME                      TYPE           CLUSTER-IP      EXTERNAL-IP    PORT(S)                                     AGE
external-homeassistant    ExternalName   <none>          10.100.2.14    8123/TCP                                    42h
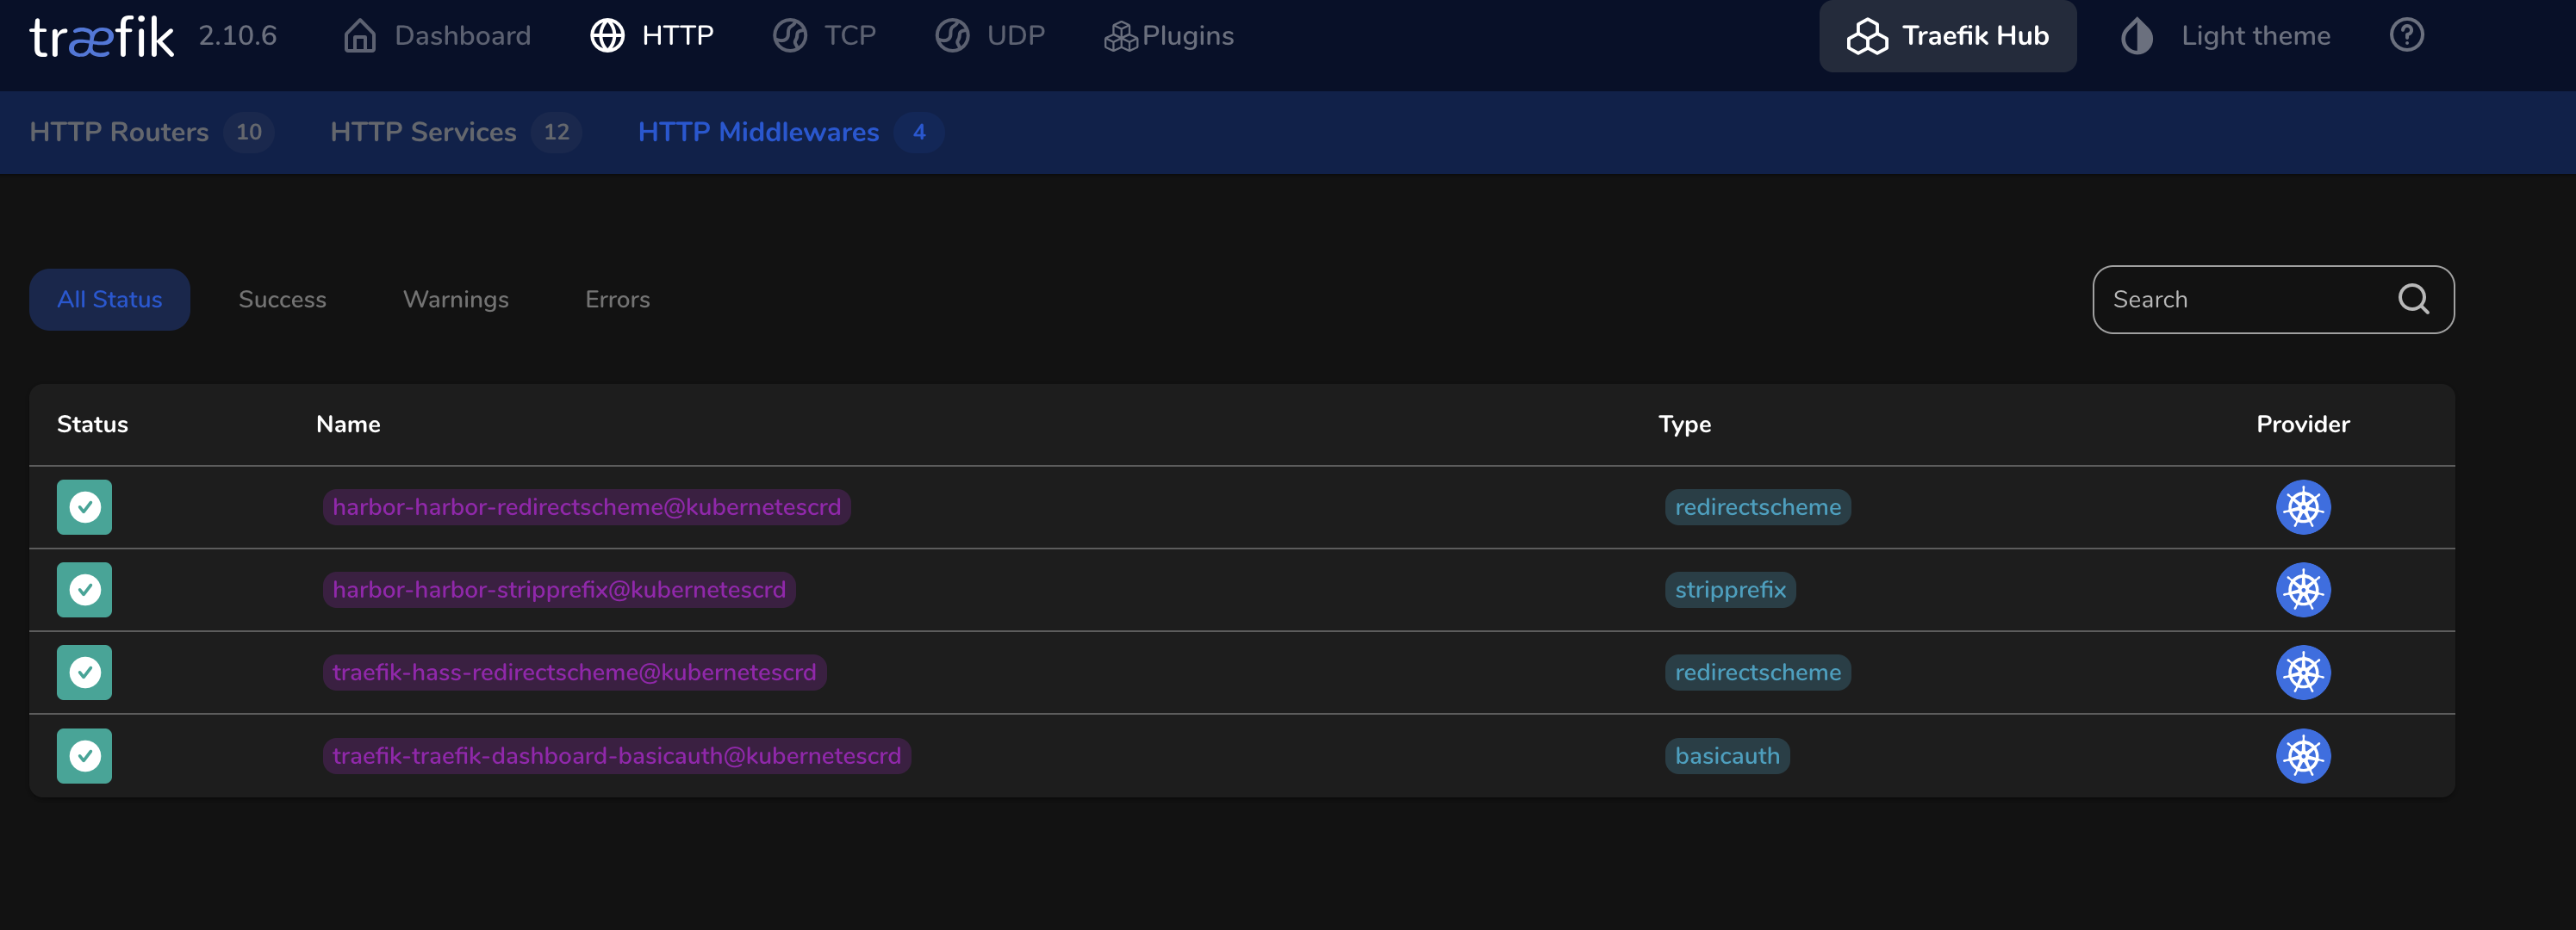
Now I needed to create a middleware to redirect all http requests to https:
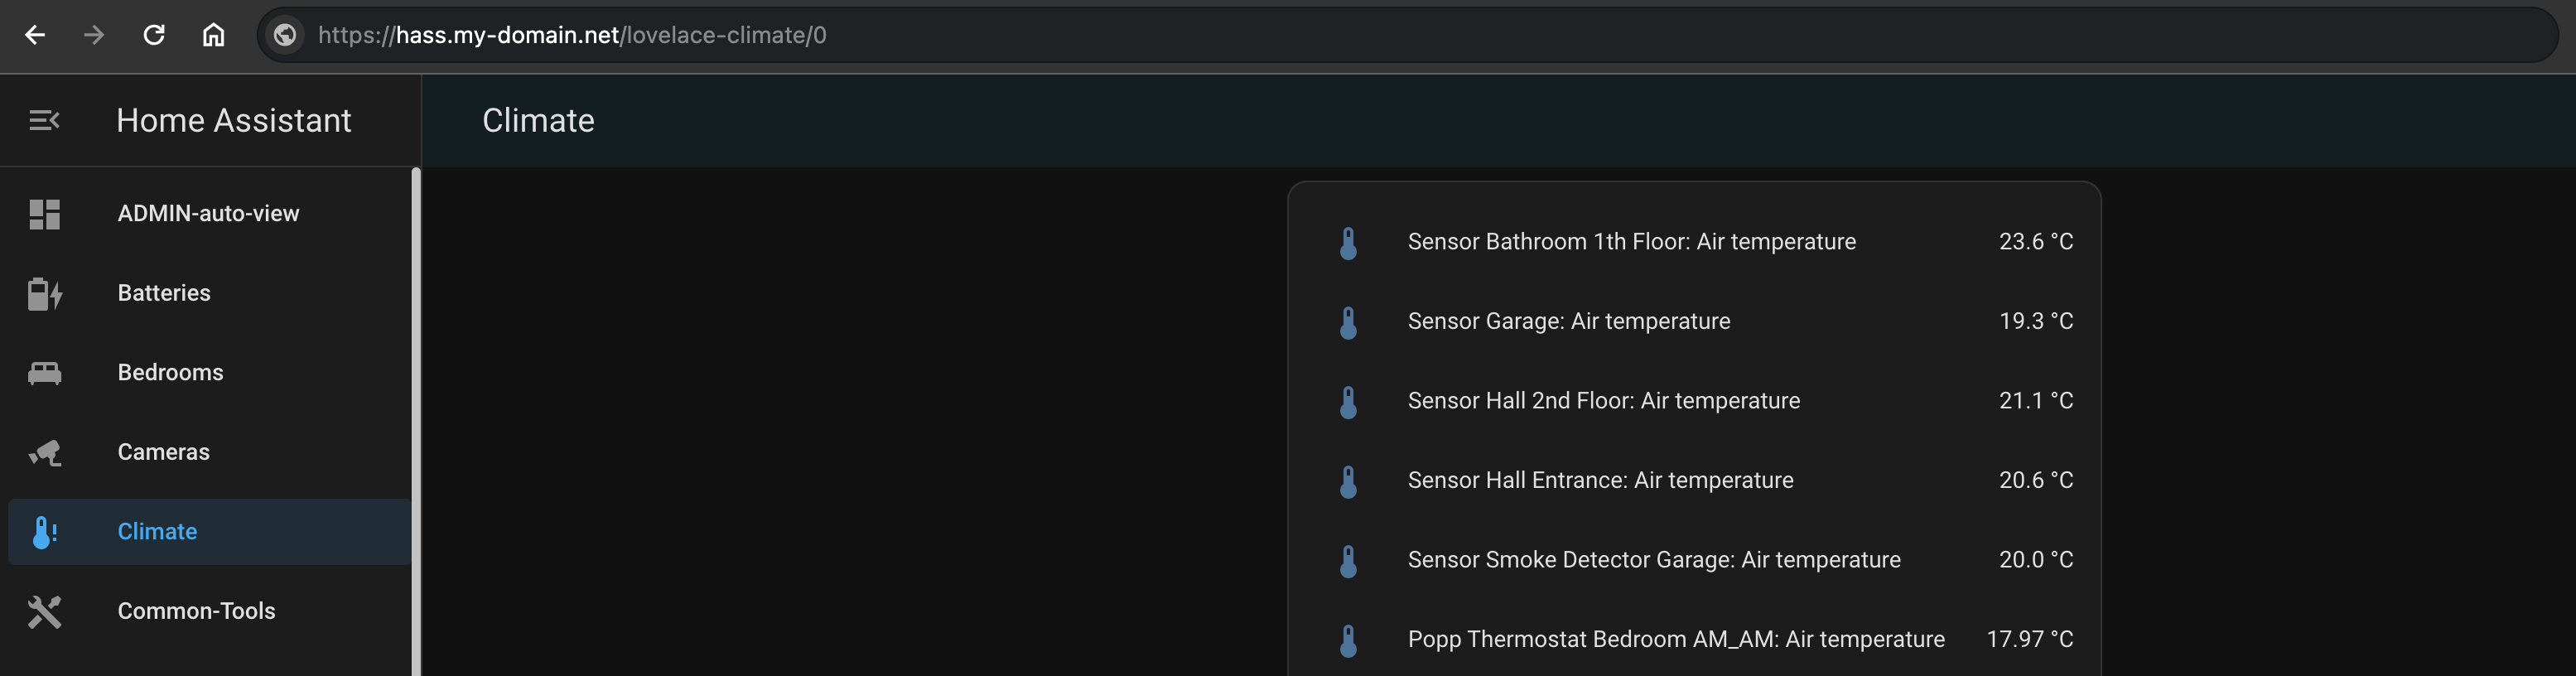
Thats it, now I can access my Home Assistant over Traefik with TLS termination. And I dont have to worry about certificate expiration as the certificate will be automatically updated by Cert-Manager.
The DNS record is pointing to the ip I have decided to use for this purpose. Same concept as earlier.
I am also running MQTT in Home Assistant to support a bunch of devices, even remote devices (not in the same house). So I wanted to use Traefik for that also. This is how I configured Traefik to handle that:
I needed to create a new entrypoint in Traefik with port 1883 called mqtt. So I edited the Traefik value yaml and updated it accordingly. Then ran Helm upgrade on the Traefik installation. Below is te config I added:
This service is not exposed to the internet, so I decided to create a third Service using another subnet for internal services, that is services within my network, but not exposed to the internet.
I then created a DNS record for the mqtt service in this IP address. Below is the service I am using for mqtt:
This Service includes the entrypoints web 80, websecure 443 AND the newly created entrypoiint mqtt 1883. Then I can reuse it for other internal purposes also.
Now I can go ahead and create another ExternalName:
expose:type:clusterIPtls:enabled:falsecertSource:secretsecret:secretName:"net-tls-prod"auto:commonName:registry.my-domain.netclusterIP:name:harborports:httpPort:80httpsPort:443externalURL:"https://registry.my-domain.net"harborAdminPassword:"password"persistence:enabled:true# Setting it to "keep" to avoid removing PVCs during a helm delete# operation. Leaving it empty will delete PVCs after the chart deleted# (this does not apply for PVCs that are created for internal database# and redis components, i.e. they are never deleted automatically)resourcePolicy:"keep"persistentVolumeClaim:registry:# Use the existing PVC which must be created manually before bound,# and specify the "subPath" if the PVC is shared with other componentsexistingClaim:""# Specify the "storageClass" used to provision the volume. Or the default# StorageClass will be used (the default).# Set it to "-" to disable dynamic provisioningstorageClass:"nfs-client"subPath:""accessMode:ReadWriteOncesize:50Giannotations:{}database:existingClaim:""storageClass:"nfs-client"subPath:"postgres-storage"accessMode:ReadWriteOncesize:1Giannotations:{}portal:tls:existingSecret:net-tls-prod
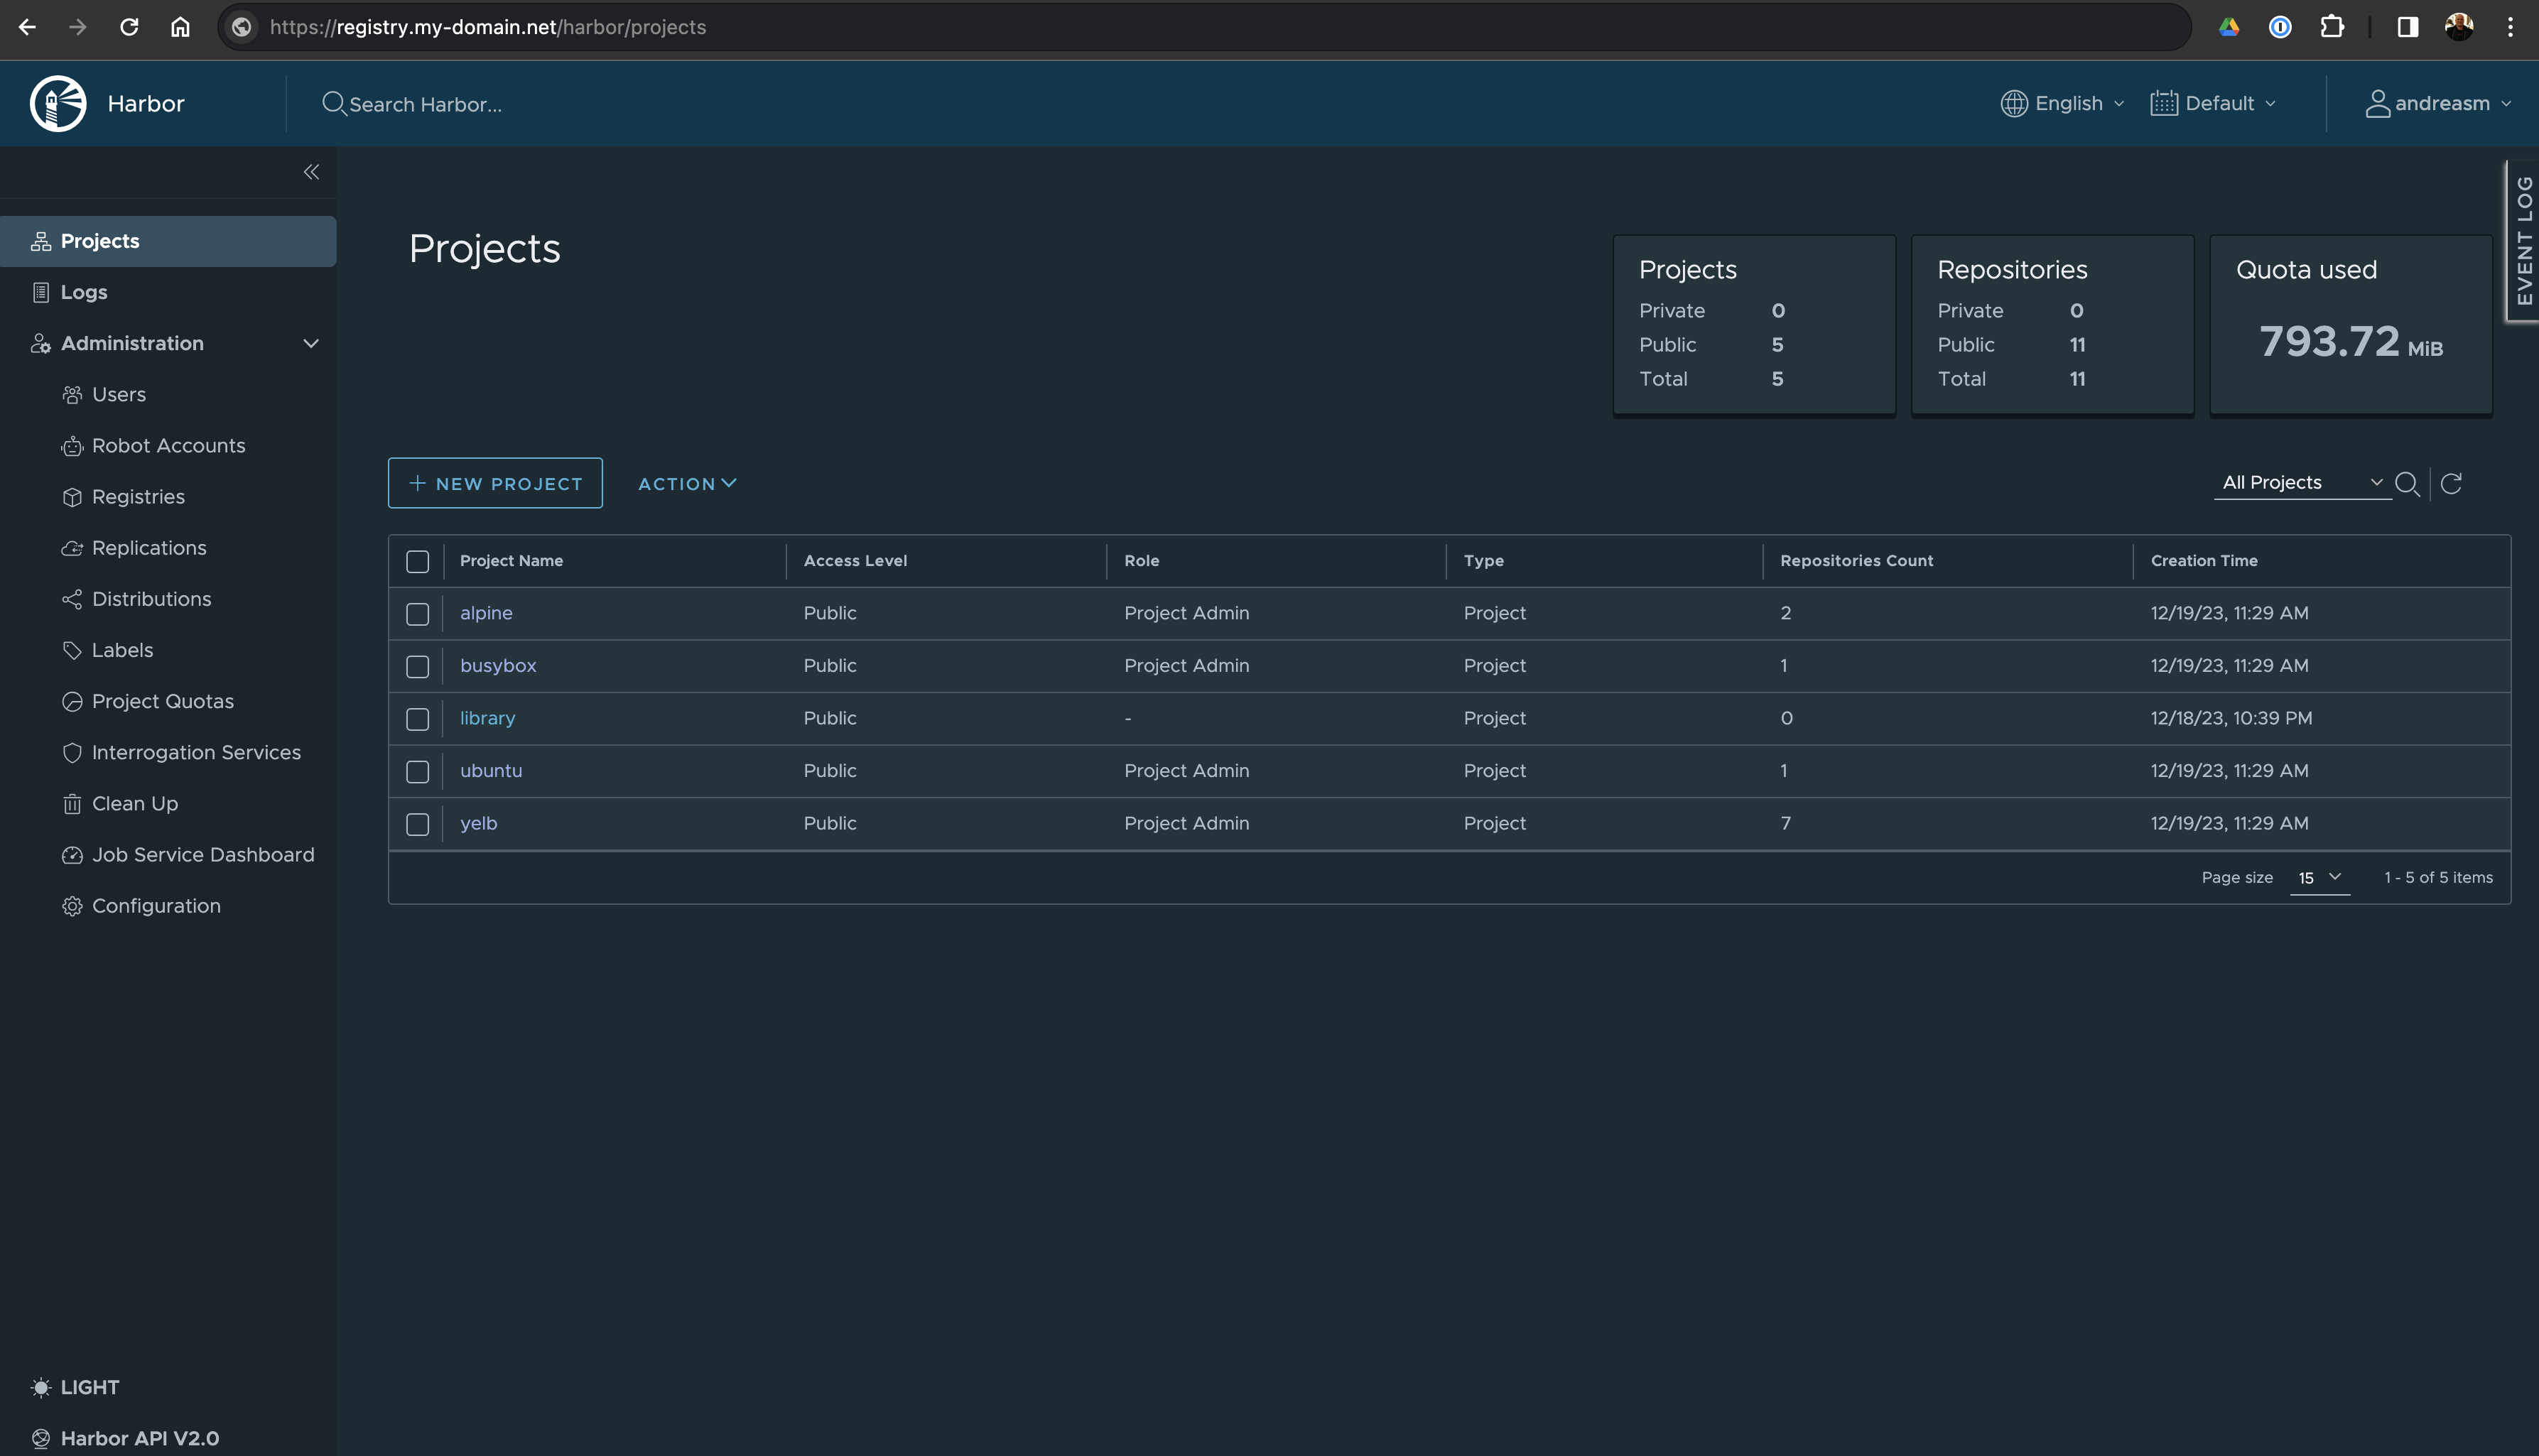
Then I install Harbor using Helm, and it should end up like this, only ClusterIP services:
I want to expose my Harbor registry to the Internet so I will be using the Service with the corresponding externalIP I am using to expose things to Internet. This will also be the same externalIP as I am using for my Home Automation exposure. This means I can expose several services to Internet using the same port, like 443, no need to create custom ports etc. Traefik will happily handle the requests coming to the respective DNS records as long as I have configured it to listen 😄
Now I just need to create a middleware to redirect all http to https and the IngressRoute itself.
andreasm@linuxmgmt01:~/prod-cluster-1/traefik/harbor$ docker login registry.my-domain.net
Username: andreasm
Password:
WARNING! Your password will be stored unencrypted in /home/andreasm/.docker/config.json.
Configure a credential helper to remove this warning. See
https://docs.docker.com/engine/reference/commandline/login/#credentials-store

Login Succeeded
I found Traefik in combination with Cilium a very pleasant experience. The ease of creating IP Pools in Cilium and using BGP to advertise the host routes. How I could configure and manage Traefik to use different external IP entrypoints covering my needs like ip separation. The built-in Traefik dashboard, using Grafana for dashboard creation using Prometheus metrics was very nice. I feel very confident that Traefik is one of my go-to reverse proxies going forward. By deploying Traefik on my Kubernetes cluster I also achieved high-availability and scalability.
When I started out with Traefik I found it a bit “difficult”, as I mention in the beginning of this post also, but after playing around with it for a while and got the terminology under my skin I find Traefik to be quite easy to manage and operate. Traefik has a good community out there, which also helped out getting the help I needed when I was stuck.
This post is not meant to be an exhaustive list of Traefik capabilities, this post is just scraping the surface of what Traefik is capable of, so I will most likely create a follow up post when I dive into more deeper and advanced topics with Traefik.