
This post will go through the IDS/IPS built-in feature of the NSX distributed firewall.
Abbreviations used in this article:
- IDS = Intrusion Detection System
- IPS = Intrusion Prevention System
Introduction to VMware NSX distributed IDS & IPS #
Before we dive into how to configure and use the distributed IDS and IPS feature in NSX let me just go through the basics where I compare the traditional approach with IDS/IPS and the NSX distributed IDS/IPS. This article is a continuation on the article Microsegmentation with VMware NSX" where I talk about east/west and north/south traffic pattern and being in context with the workload its supposed to protect. Where being in context is a key thing, especially when it comes to security policies and IDS/IPS. Know what you are protecting, make the inspection as relevant as possible, inspection done optimal (reduce false positives, maintain performance) and at the right place.
The traditional way of using IDS/IPS #
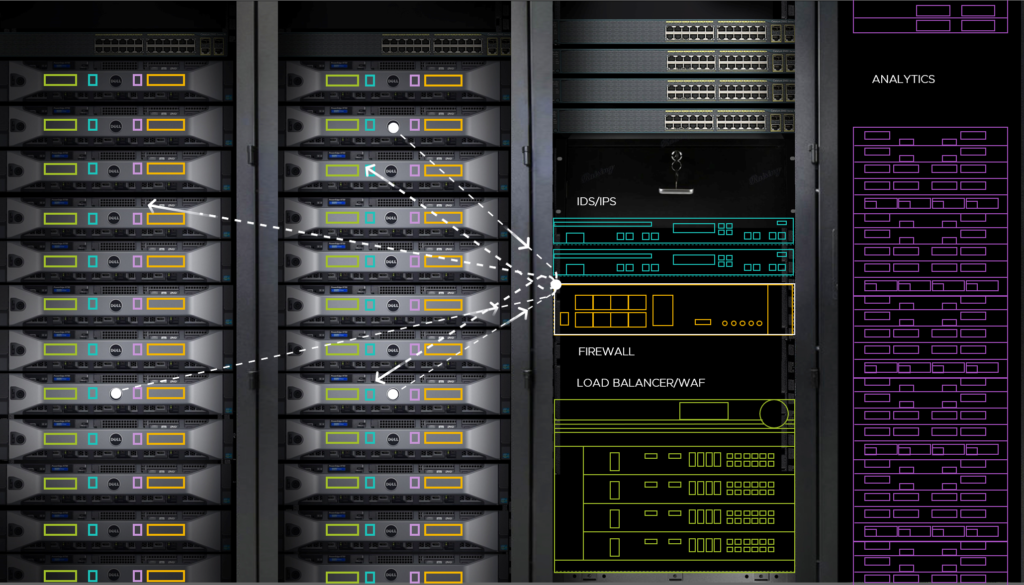
In a more traditional infrastructure we have the perimeter firewall that is responsible for the “environment” policies, enforcing policies between the environments and allowing/blocking different types of the services from each environment to communicate. In such an scenario it is often also the same perimeter firewall that is enabled with IDS/IPS. In a datacenter full of virtualized workload this leads to hairpinning the traffic to a centralized appliance for inspection with the consequence of reducing performance, a lot of unnecessary traffic is sent out to the physical infrastructure to reach the perimeter firewall and sent back again. The appliance is not in context of the workload its analyzing traffic from/to so its hard to be very specific enough when it comes to the right signatures etc. The picture below illustrates this:
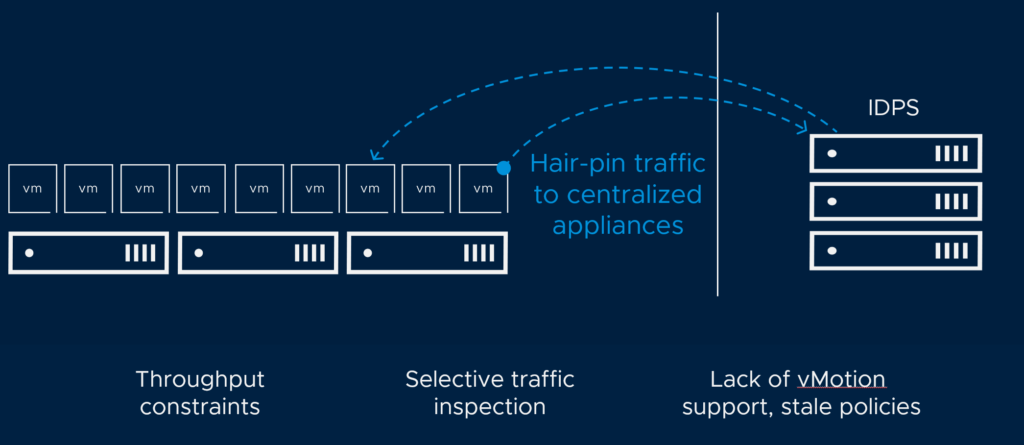
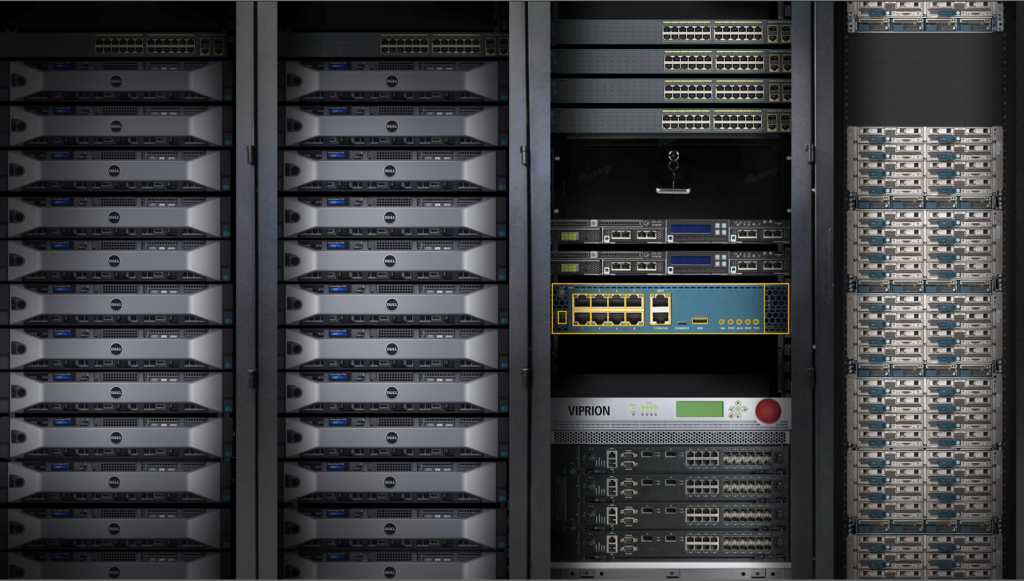
IDS/IPS with a centralized appliance
NSX Distributed IDS and IPS #
To overcome the challenges of hairpinning traffic in an virtualized environment, we need to have the firewall, IDS and IPS enforced where the workload actually resides. This saves unnecessary traffic being sent out on the physical infrastructure if its not meant to go out and it also gives the network logics (firewall/IDS/IPS) to be part of the dataplane where the actual workload its supposed to protect resides and can have much more insight (being in context of) in whats going on. Things as knowing its a Ubuntu 20.04 and MySQL server you are protecting, makes it much easier to create the firewall policies but also much more pinpointed/granular IDS/IPS policies. This leads to very specific IDS/IPS rules, no false positives, better performance. This is where NSX Distributed IDS and IPS comes into play. Both the NSX Distributed Firewall and IDS/IPS runs on the same host as the virtual workload you are protecting. Its not necessary to redirect traffic, no need to change anything in the infrastructure, its as simple as just enabling the feature and create policies. Those policies can be created with an application centric perspective, as we have the ability to know the workload we are protecting as the below illustration:
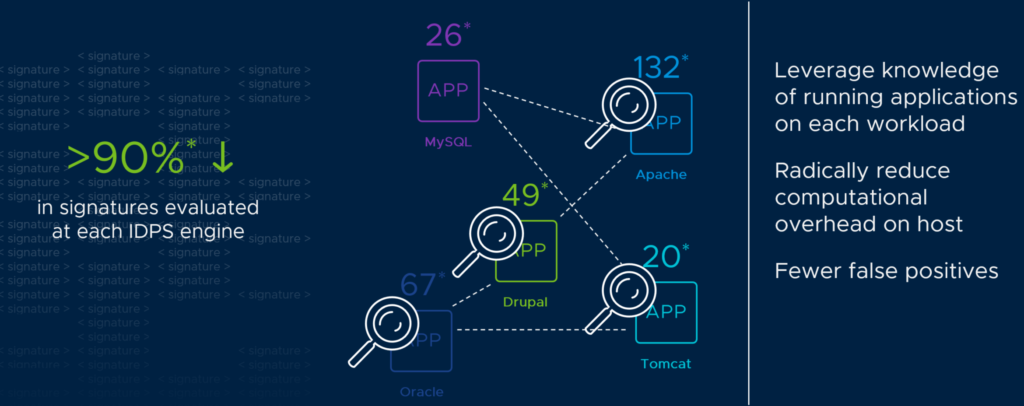
IDS/IPS polices with only workload relevant signatures
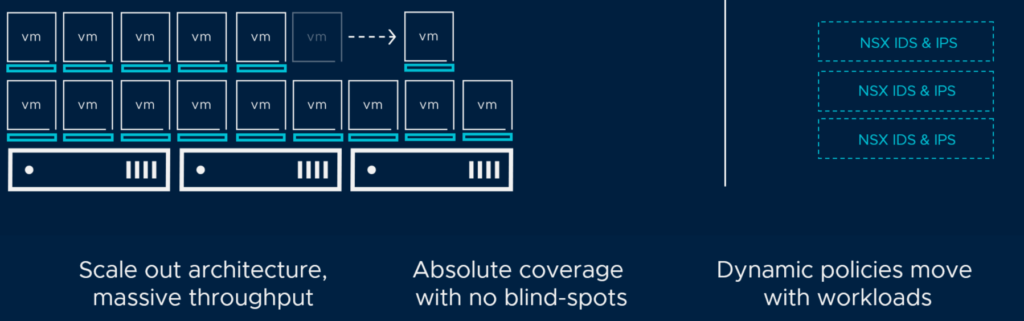
IDS/IPS available on each hypervisor host
How to use IDS & IPS in VMware NSX-T #
To get started with IDPS in NSX is very easy, its already installed on your transport nodes when you have them enabled with NSX. In the following sections I will go through the different parts in the NSX gui that involves the IDPS part and finish up with an example of how to create policies.
Enable IDPS, settings and signature updates #
When one log in to the NSX manager GUI one will see it is divided into different categories such as Networking, Security, and Inventory. IDPS is certainly a security feature of NSX so we will head over there.
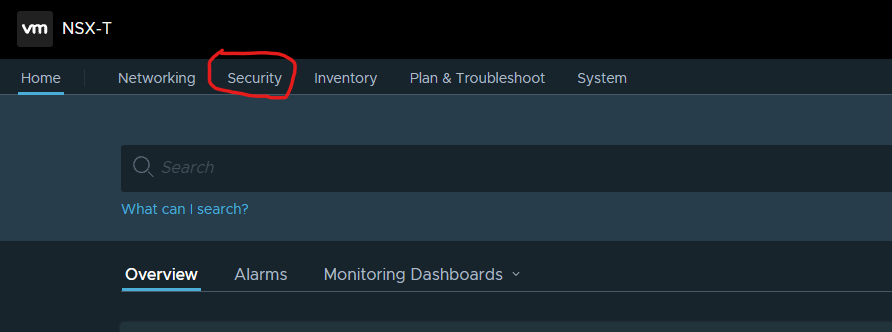
After clicking on the Security tab, it will take us to the Security Overview page:
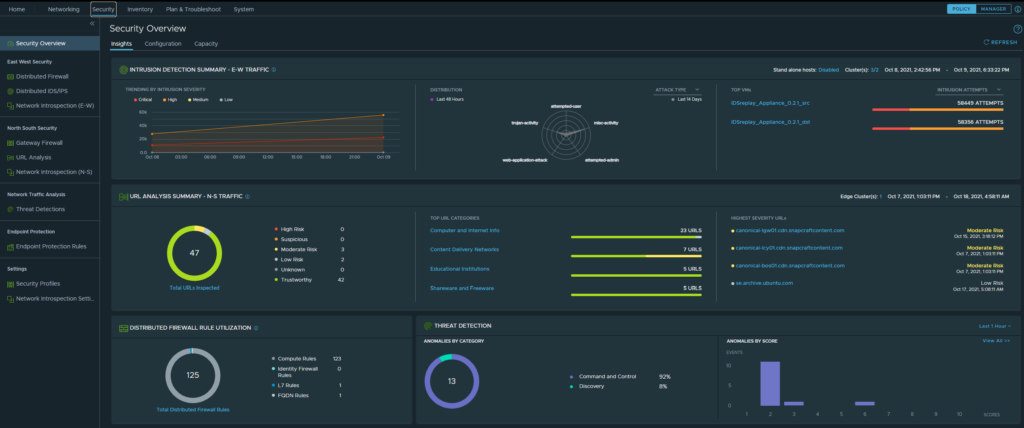
NSX Security Overview
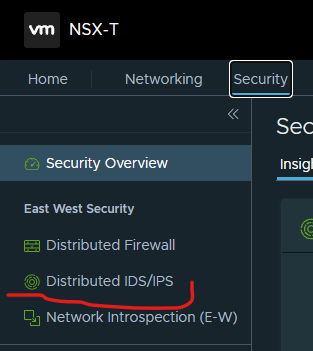
As one can see this gives us a great summarized view over the different security parts in NSX, the IDPS, URL Analysis, the DFW, Anomalies. To see more details in the specific area click on the respective feature on the left side menu. In our case, this is the Distributed IDS/IPS menu.
When inside the Distributed IDS/IPS section, head over to the settings page:
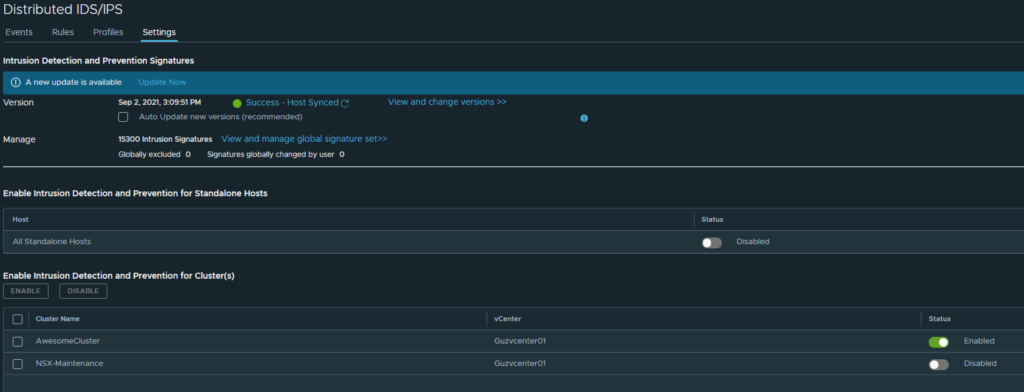
Settings page of IDPS
On this page we can manage the signatures (versions), see the status on the signatures version, whether there is an update on the signature database, update and or adjust whether updates are done automatically. If we want to view the complete list of available signatures click on “View and Manage global signature set”. It should present us a list of all signatures:
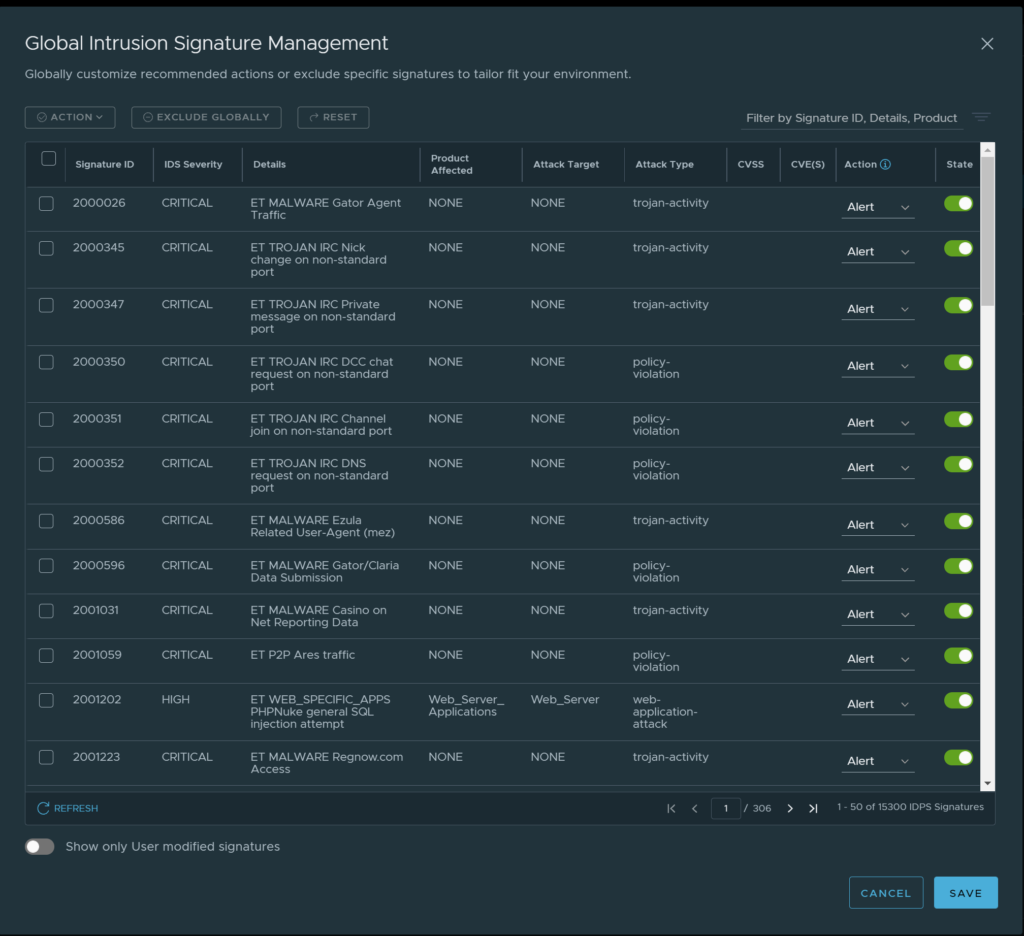
Global signature set
Here we can search for a specific signature, or signatures based on the filter you choose in the top right corner. Say I want to search for signatures relevant to MySQL, I type in “mysql”:
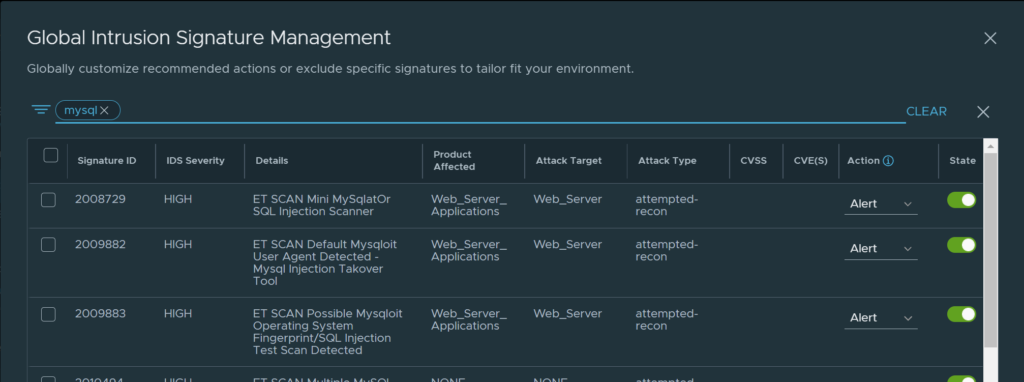
Mysql filter
But I can also search for a specific CVE ID (one that we have recently been alerted on maybe):
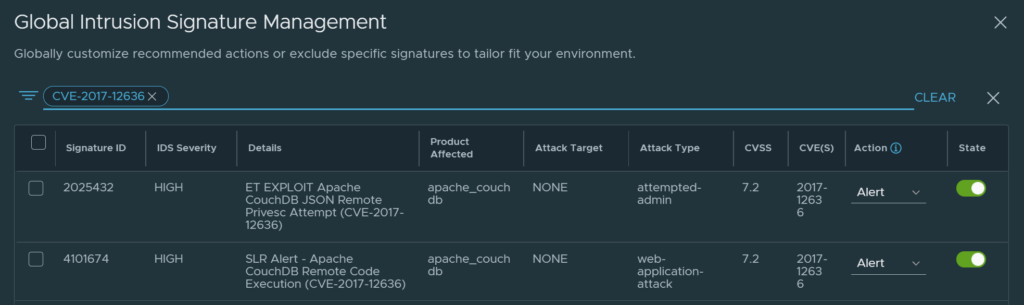
CVE-2017-12636
Or a filter based on CVSS score, in this example 7.5:
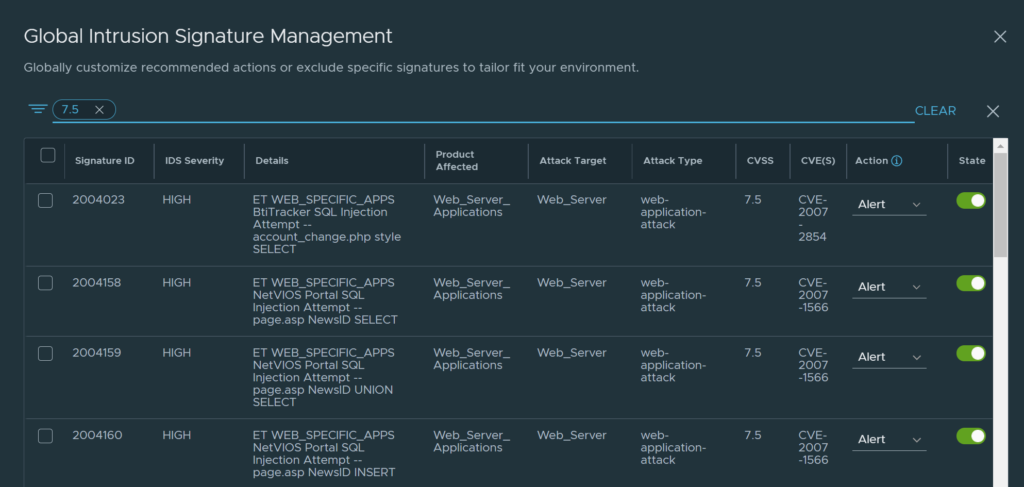
CVSS 7.5
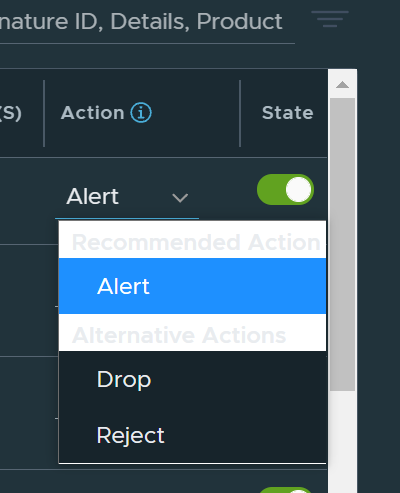
We can also adjust the Global default action on specific signatures from Alert, Drop and Reject:
By hovering over the blue (!) we will be presented with an explanation of how this works:
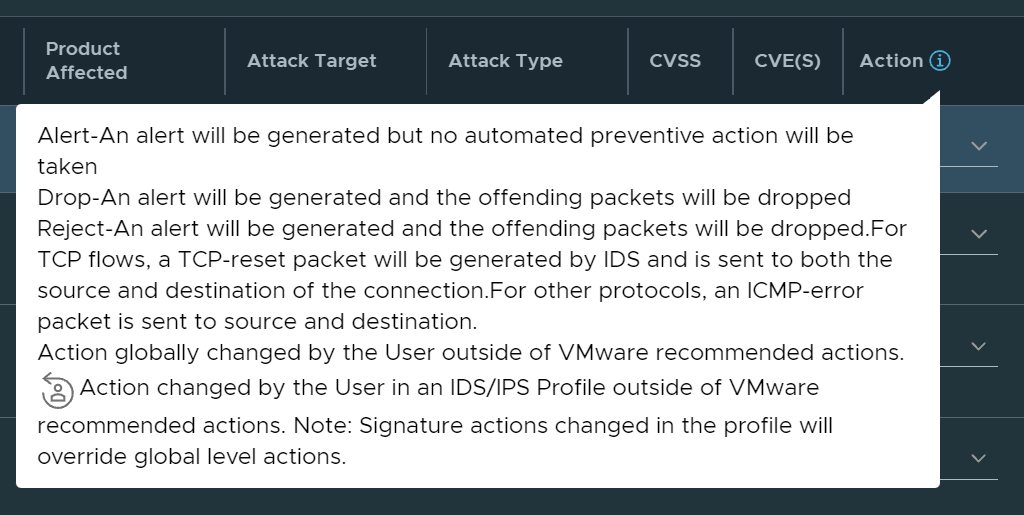
Instead of overriding the global setting for a set of signatures here, we will do this in the next section “IDPS Profiles”.
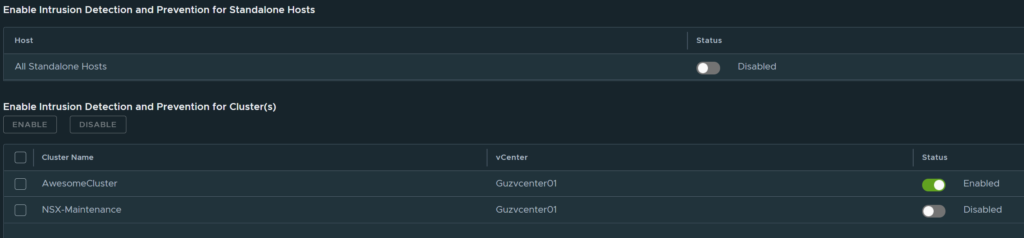
Further down on the same page is where we enable or disable the IDPS feature. It can be enabled on a vSphere cluster (a set of hosts managed by a vCenter) or standalone ESXi hosts. And its just as simple as clicking the enable button on the right side. It should turn green when enabled.
Now that IDPS is enabled lets head over to Profiles.
IDPS profiles #
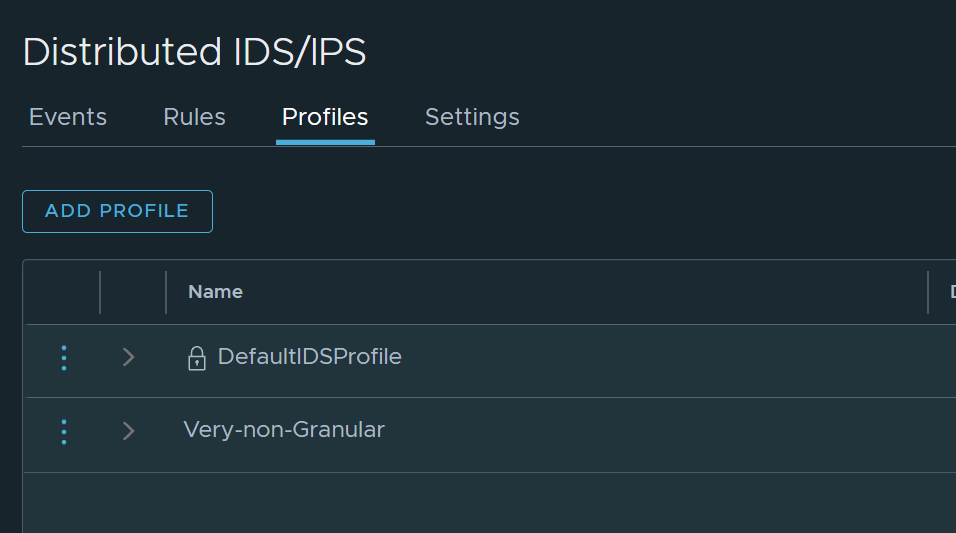
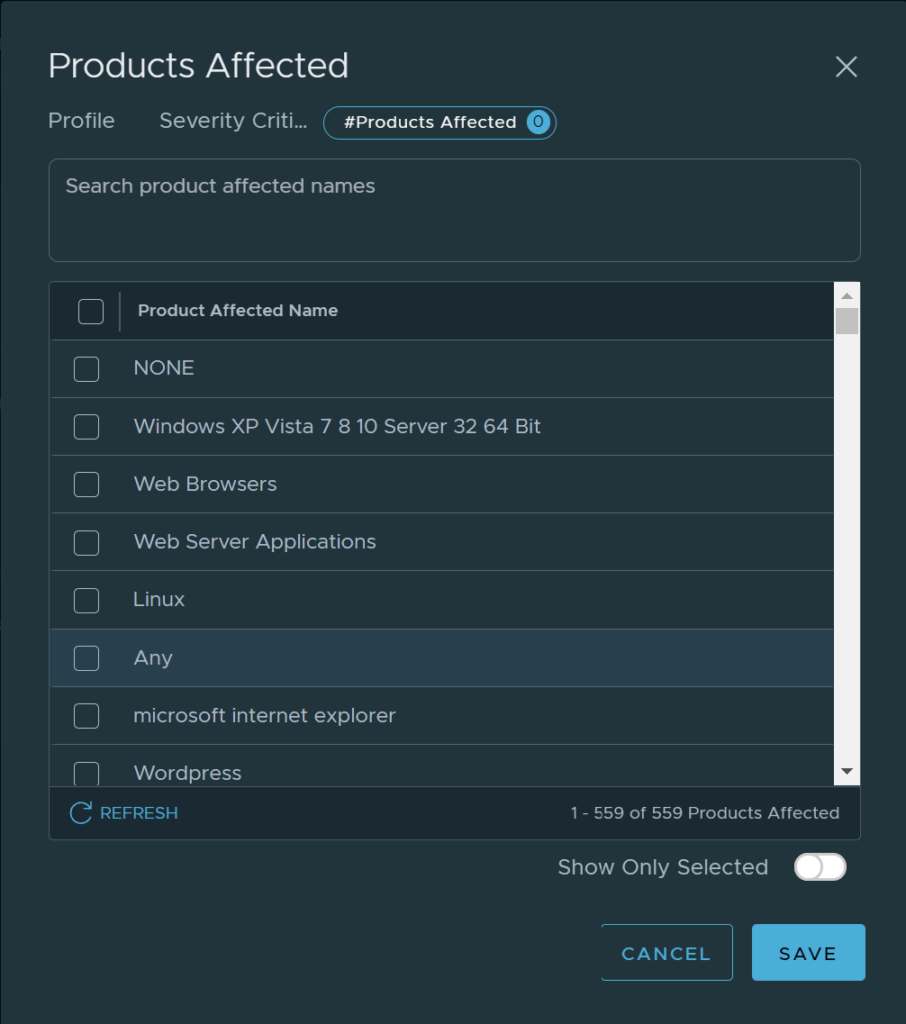
The profiles section is where we create our application specific signatures we want to use in our IDPS policies (later). We want to adjust and narrow down the total amount of signatures to be used when we create our idps policies for our workload. If I want to create an IDPS policy for a specific application I should create a profile that matches this to reduce false positives, and maintain an optimal inspection with IDS/IPS as an added security feature on top of the Distributed Firewall. In my demo I am interested in only vulnerabilities affecting product “Linux”.
Lets start out by clicking “Add Profile” and create the profile.
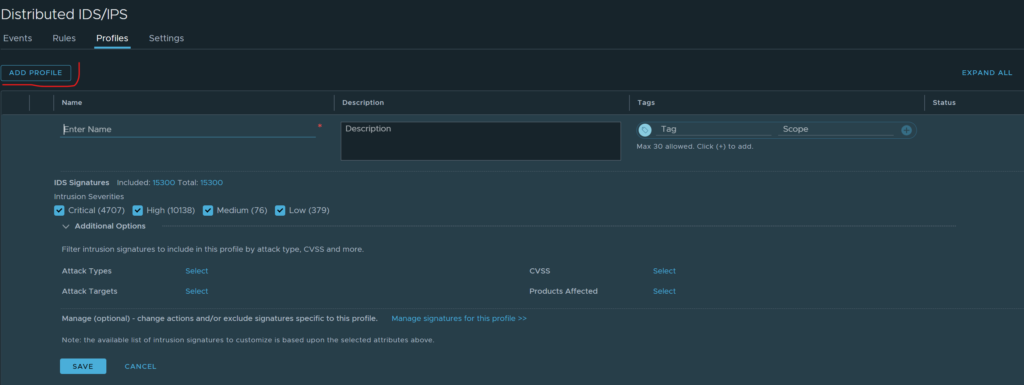
New profile
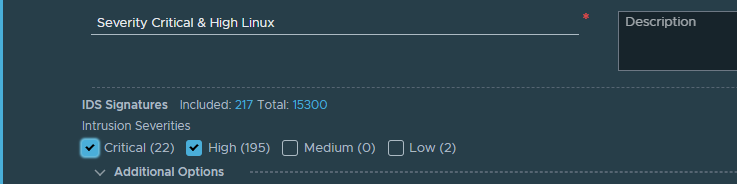
Give the profile a name and start adjusting the signatures we want to use, we start by deciding the Severity Category (Critical, High, Medium and Low). For more information on these categories look here: https://docs.vmware.com/en/VMware-NSX-T-Data-Center/3.1/administration/GUID-4343E565-7AC2-40C2-8B12-5FC14893A607.html
After the severity category has been decided we can go ahead and further adjust the specifics we are looking for, please also make note of the IDS Signatures Included number as we proceed in our selection.
Before any selections done:
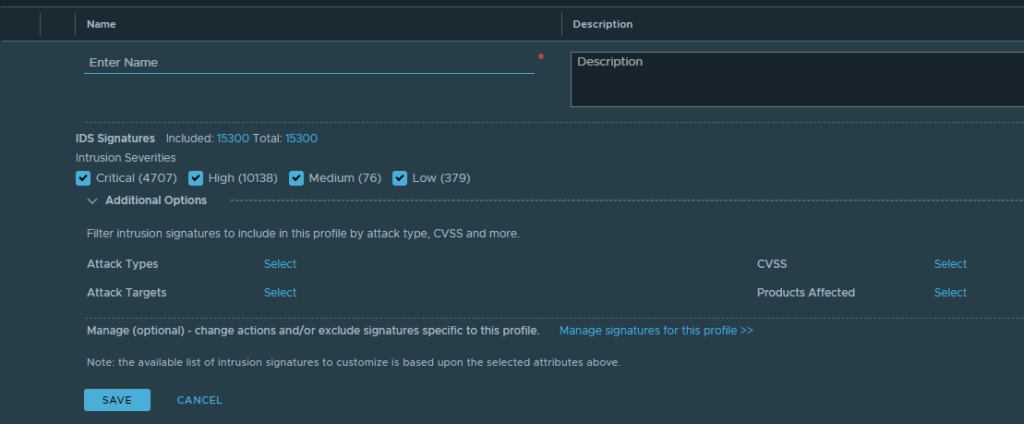
Default
I will go ahead with Severity Critical & High
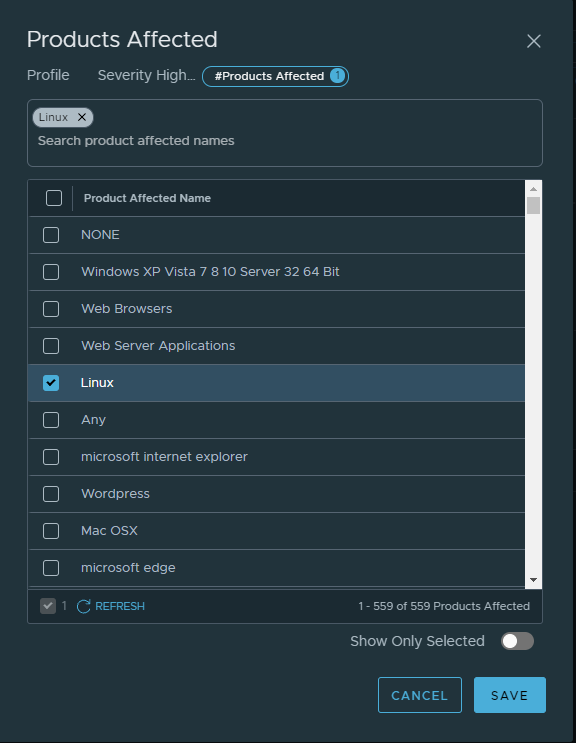
Then I can proceed with a selection based Attack Types, Attack Targets, CVSS and Products Affected. I will just post a screenshot from each four options:
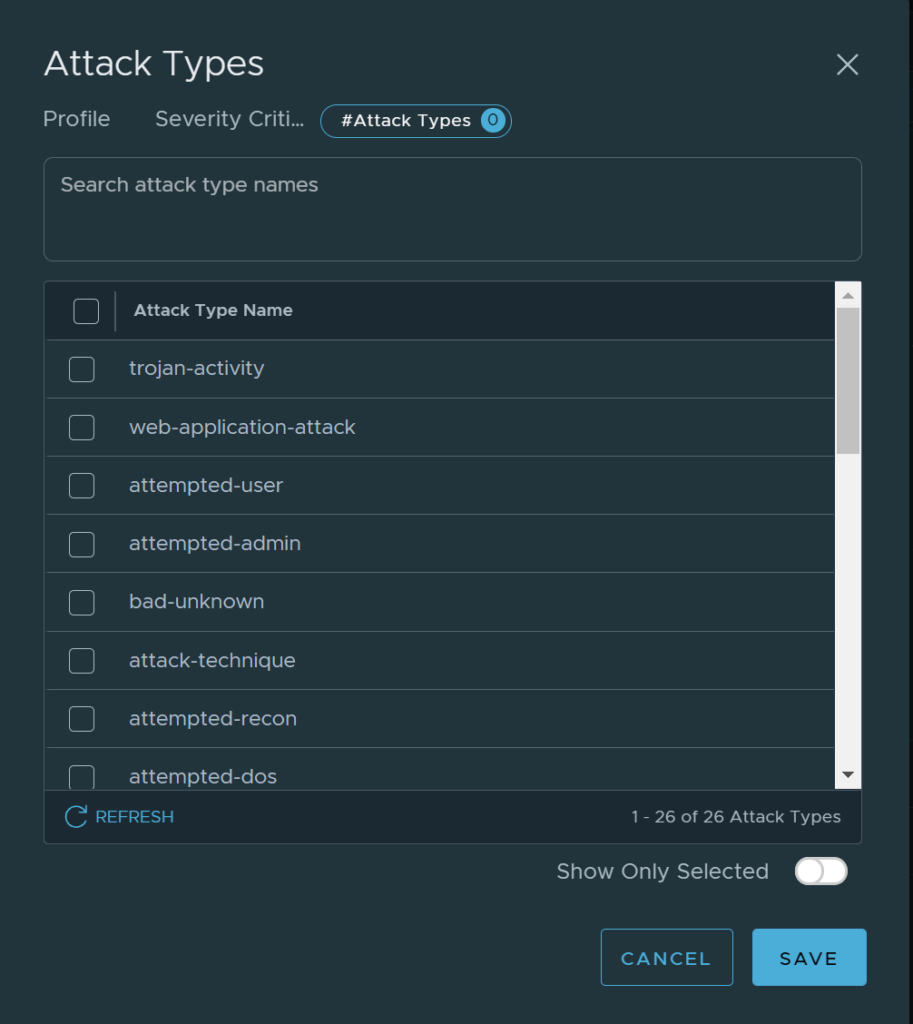
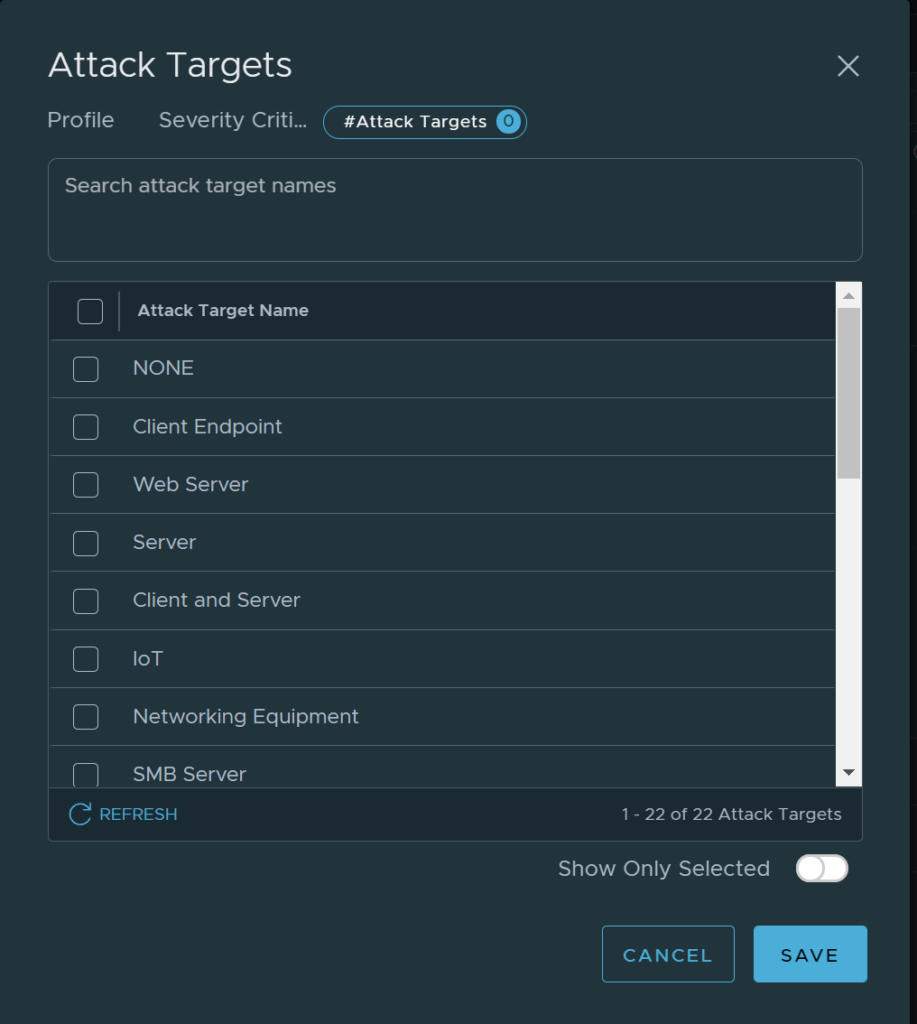
Search is possible
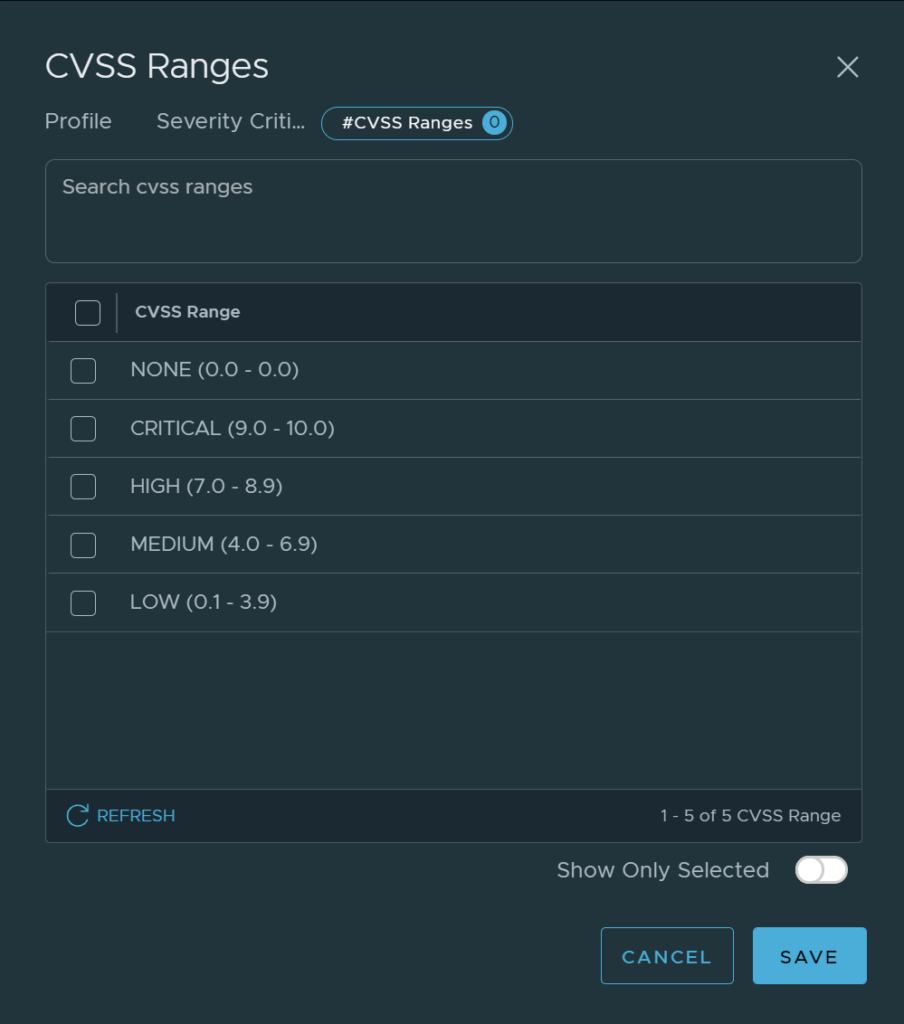
Search is possible
I will adjust my profile with only Products Affected (this is done to justify the demo of IDS):
I am satisfied with my selection from now. Let look at the profile now:
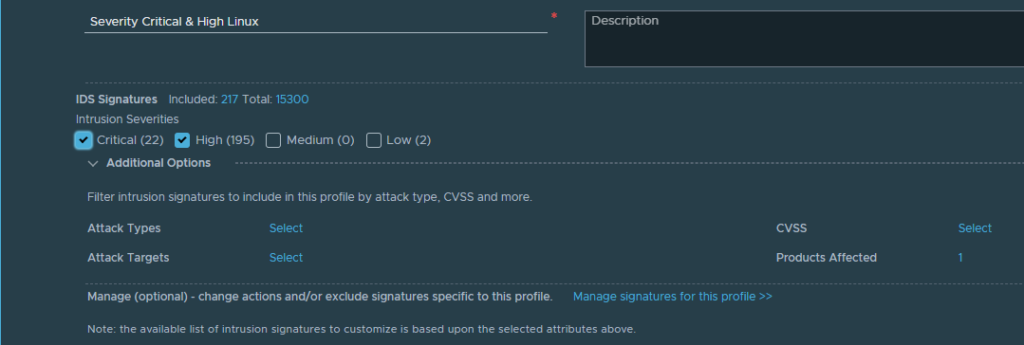
Now I am down to 217 signatures in this specific profile. I also have an option now to override the default action when/if IDPS detects anything and how to respond. Click on the “Manage signatures for this profile” and we should be presented with the signatures relevant only for this profile (after the selection is done):
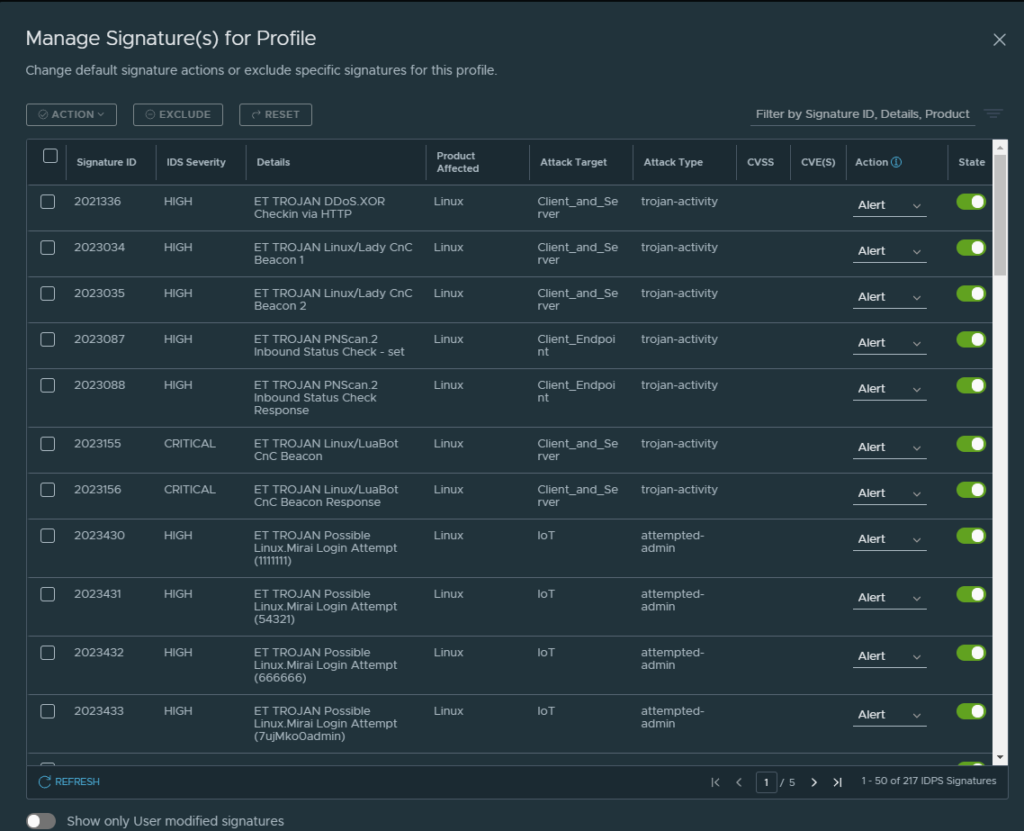
There is an important note to take here. If we only have Alert on the signature, and we want to create an IDPS policy with Detect & Prevent one must have the signature action to either Drop or Reject also. Its not sufficient to just create a policy with Detect & Prevent. That is brilliant if we have signatures in the same profile we don’t want to be dropped, but we only want to be notified. Then we can have one rule with Detect & Prevent where some traffic is being dropped (Prevent) while the other is just notified (Detect). So if there is one CVE that you really should drop here you have the option to select just the few of those.
Lets apply the profile to a policy/rule in IDPS so it can act upon it.
IDPS Policy #
Under rules in the Distributed IDPS section in NSX:
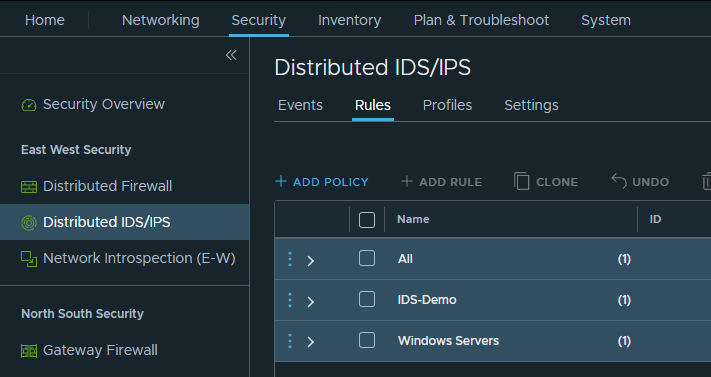
Click + Add Policy, this creates a new section:
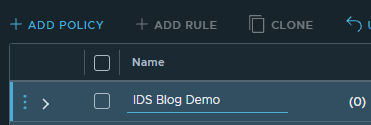
Name it and then click on the three dots on the left side to create a rule:
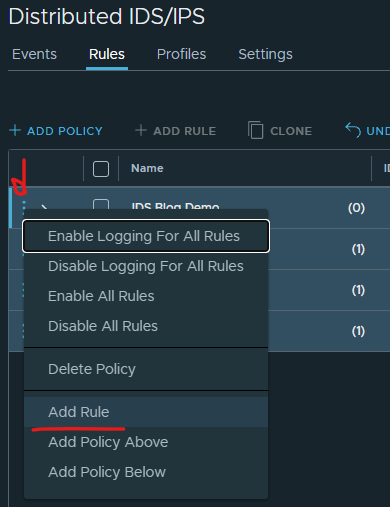
Should now look like this:

Now we need to fill in source, destination, our IDS Profile created earlier, where to apply the policy and action (mode). In the example below I have already created a couple of security groups (security groups explained in the NSX Distributed firewall article) so I just need to add them to the respective source/destination:

IDS rule applied to groups used in source and destination
Click publish and your rule is in effect immediately.
Also notice that I did not specify a Service in my rule, here you can be more specific by add the service also, if you know its HTTP for example.
Now let us check if it detects something….
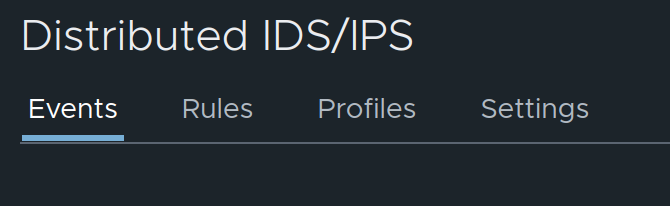
Distributed IDS/IPS Events #
To view detected events, and drill down into the occured events, we must head over to the Events section in our Distributed IDS/IPS section.
Here we can get a an overview with a timeline on when and where the events have occured.
If we look at the overview we can quickly notice if there has been any event in the last 24 hours, 48 hours, last 7 days or 14 days. Lets go through the Events page. Below is a screenshot showing last 24 hours.
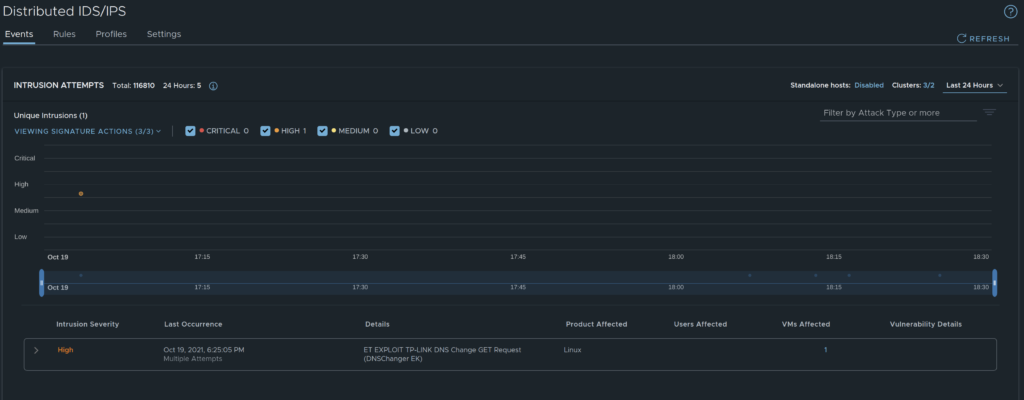
Overview
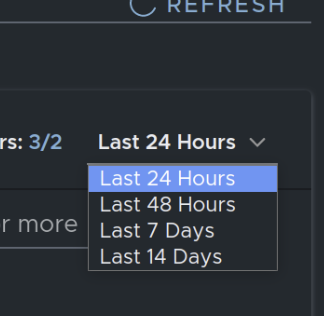
To change the timeline from default 24 hours, take a look at the top right corner and click on the arrow to get the drop down menu.
Now look at the timeline view using Last 24 hours I can see that there has been 1 event represented by a an orange dot.
That tells me very quickly that there has atleast been detected an event. The color code tells me that the event is of severity High.
If there are many events in the timeline view, I can choose to filter out the severity I am interested in by unchecking the others.
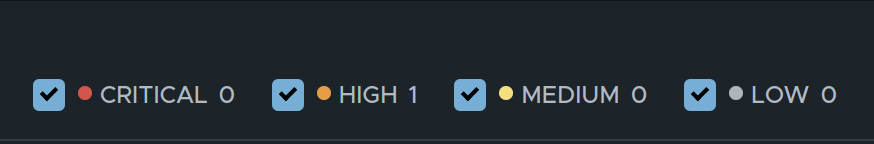
Legend color codes
By hovering over the orange dot I can get more information on the event:
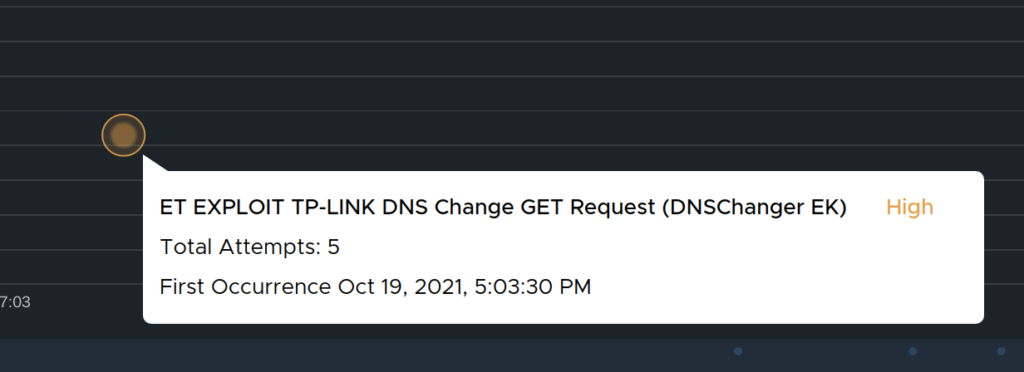
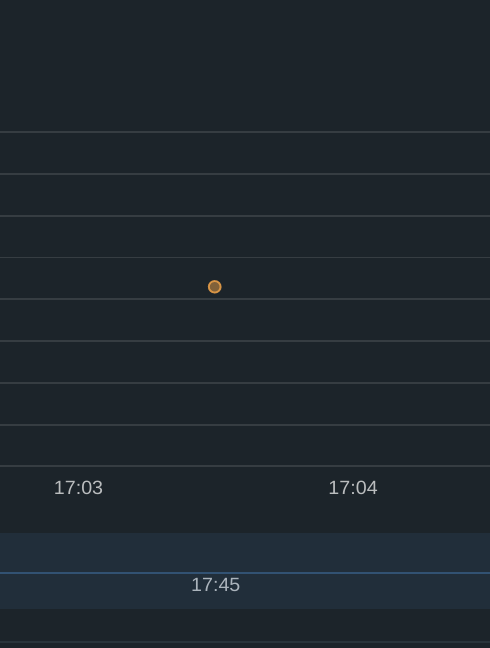
I can see what kind of event, and how many attempts of the same kind. If you look closer on the timeline view there are several dots represented. Those represent the other attempts of the same kind. The colored dots will only represent unique occurences within the given timeline. Its also possible to adjust your timeline further if you want to inspect events happening at a certain time within the 24 hours timeline by adjusting the blue sliders:
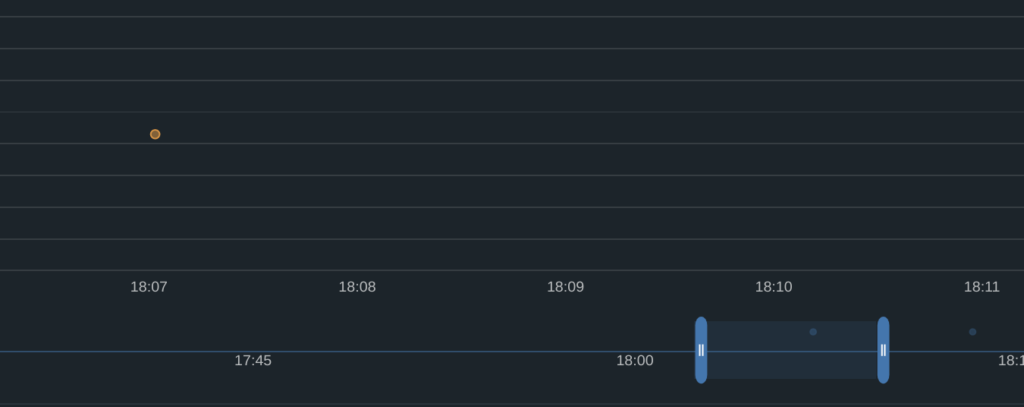
Adjusted timeline view
Then if I adjust it to say just before 18:10 and just after (where there is a dot) the orange dot will appear again as this event suddenly will be unique for this specific time. The bigger timeline view will be updated accordingly. Now I want to know more of this specific event. Look further down, it will be a list (if several unique events has occured represented, again within the timeline give above). The detailed list below will also update according to the adjusted timeline.
If one take a look at the below event it says under occurence “Single Attempt”, but I know there are multiple attempts, as I saw before I adjusted the timeline. I “reset” the timeline view back to the full 24 hours view it will be updated to multiple attempts.

Single attempt at the given timeline
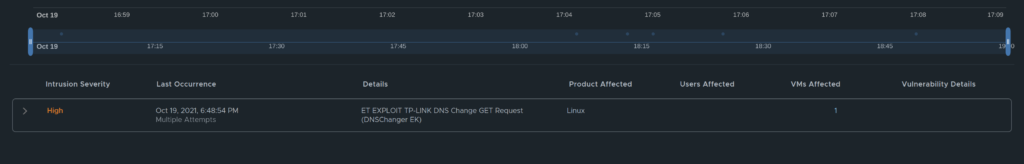
Multiple attempts over a longer timeline
Now if one click on the arrow on the left side more information will be revealed.
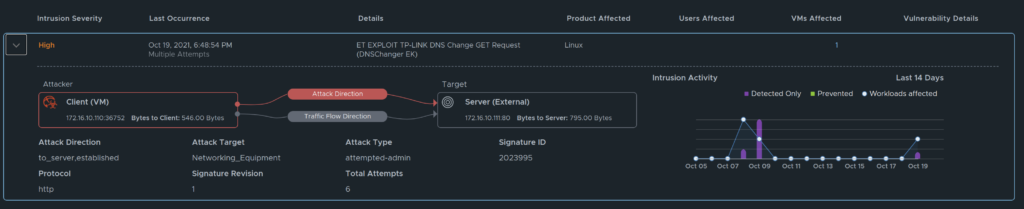
In this view I can see the source (the attacker, where it is initiated from) and the destination (the target, victim of the “attack”). Intrusion activity, detected and prevented. The number of VMs affected. If one click on the number below VMs affected we will also see a list of VM(s) affected with names:
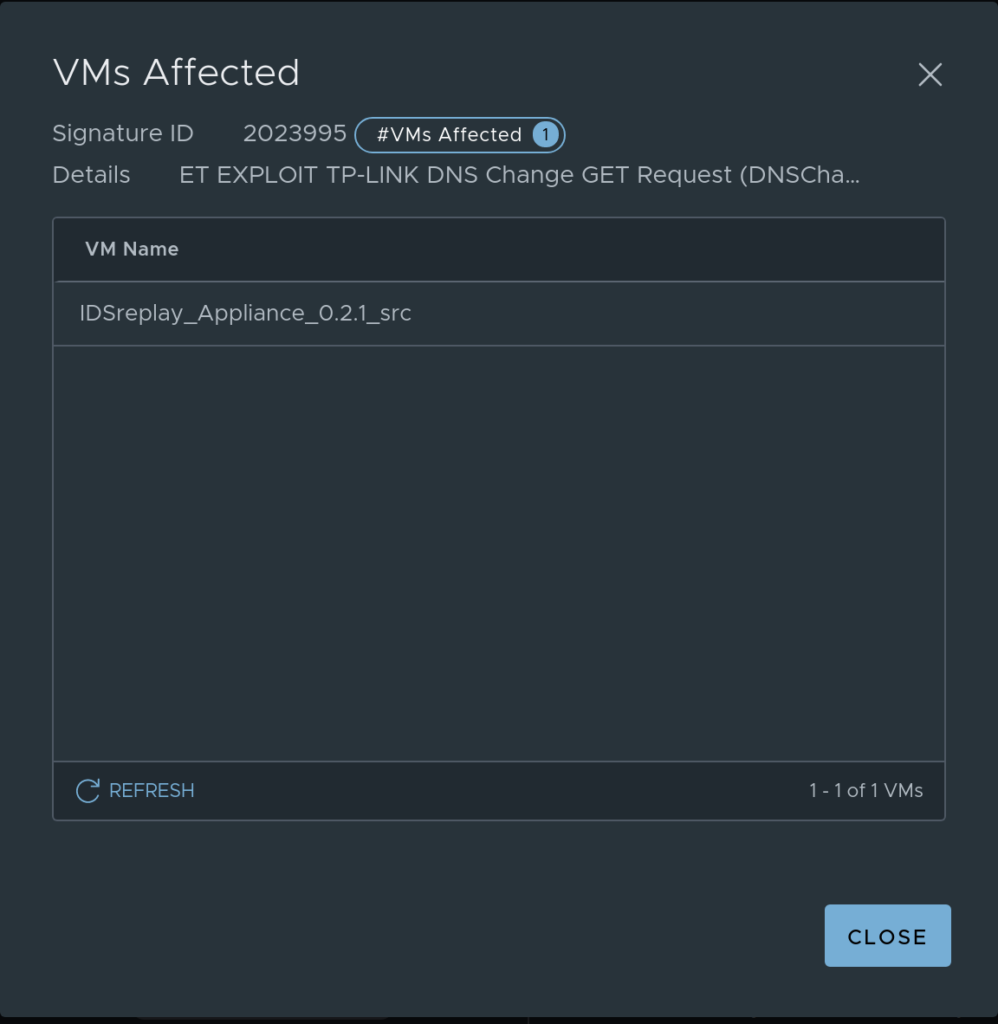
If I now go back to my profile defined earlier, I want to change the signature ID 2023995 to drop and also update my policy to Detect & Prevent. Lets see how this affects the detailed view.
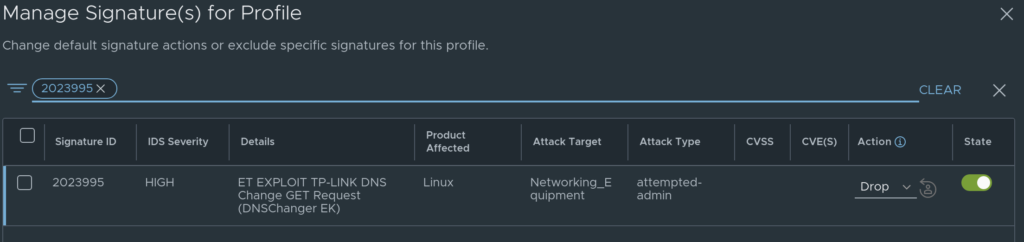
Updated the profile

Updated the policy
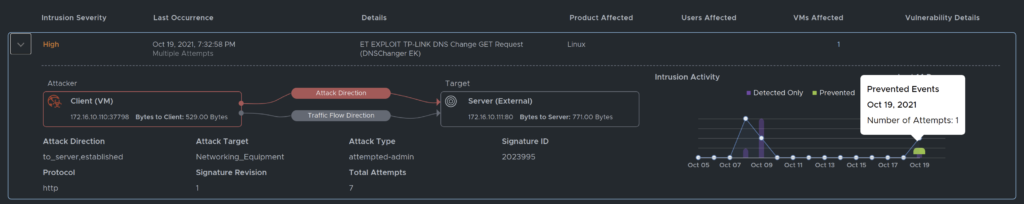
Prevented events
With the profile on this specific signature ID sat do drop and the policy sat to Detect & Prevent it also drops the specific attempt. Meaning I can have a good night sleep, or can I….?
I should probably do something with the source also. But that should be easy now that we know what the source is.